Tested 2025-04-27 05:49:50 using Chrome 135.0.7049.52 (runtime settings).
| Metric | Value |
|---|---|
| Page metrics | |
| Performance Score | 94 |
| Total Page Transfer Size | 197.9 KB |
| Requests | 10 |
| Timing metrics | |
| TTFB [median] | 658 ms |
| First Paint [median] | 1.432 s |
| Fully Loaded [median] | 1.436 s |
| Google Web Vitals | |
| TTFB [median] | 658 ms |
| First Contentful Paint (FCP) [median] | 1.432 s |
| Largest Contentful Paint (LCP) [median] | 1.432 s |
| Cumulative Layout Shift (CLS) [median] | 0.00 |
| Interaction To Next Paint (INP) [median] | 592 ms |
| CPU metrics | |
| CPU long tasks [median] | 1 |
| CPU longest task duration | 139 ms |
| CPU last long task happens at | 1.228 s |
| Visual Metrics | |
| First Visual Change [median] | 1.400 s |
| Speed Index [median] | 1.401 s |
| Visual Complete 85% [median] | 1.400 s |
| Visual Complete 99% [median] | 1.466 s |
| Last Visual Change [median] | 1.500 s |
| Metric | min | median | mean | max |
|---|---|---|---|---|
| Visual Metrics | ||||
| FirstVisualChange | 1.266 s | 1.400 s | 1.473 s | 1.900 s |
| LastVisualChange | 1.333 s | 1.500 s | 1.607 s | 2.200 s |
| SpeedIndex | 1.267 s | 1.401 s | 1.475 s | 1.906 s |
| LargestContentfulPaint | 1.266 s | 1.400 s | 1.473 s | 1.900 s |
| LastMeaningfulPaint | 1.266 s | 1.400 s | 1.473 s | 1.900 s |
| VisualReadiness | 67 ms | 100 ms | 133 ms | 300 ms |
| VisualComplete85 | 1.266 s | 1.400 s | 1.473 s | 1.900 s |
| VisualComplete95 | 1.266 s | 1.400 s | 1.473 s | 1.900 s |
| VisualComplete99 | 1.300 s | 1.466 s | 1.580 s | 2.200 s |
| Google Web Vitals | ||||
| Time To First Byte (TTFB) | 505 ms | 658 ms | 627 ms | 666 ms |
| Largest Contentful Paint (LCP) | 1.252 s | 1.432 s | 1.488 s | 1.928 s |
| First Contentful Paint (FCP) | 1.252 s | 1.432 s | 1.488 s | 1.928 s |
| Cumulative Layout Shift (CLS) | 0 | 0 | 0 | 0 |
| More metrics | ||||
| firstPaint | 1.252 s | 1.432 s | 1.488 s | 1.928 s |
| loadEventEnd | 961 ms | 1.115 s | 1.134 s | 1.378 s |
| CPU | ||||
| Total Blocking Time | 0 ms | 0 ms | 0 ms | 0 ms |
| Max Potential FID | 0 ms | 0 ms | 0 ms | 0 ms |
| CPU long tasks | 1 | 1 | 1 | 1 |
| CPU last long task happens at | 1.073 s | 1.228 s | 1.298 s | 1.748 s |
Run 2 SpeedIndex median
Use--filmstrip.showAll to show all filmstrips.
 0 s1.2 sDOM Content Loaded Time 1.115 sPage Load Time 1.115 s1.3 sCPU Long Task duration 130 ms
 1.4 sFirst Visual Change 1.400 sVisual Complete 85% 1.400 sVisual Complete 95% 1.400 s
 1.5 sFirst Contentful Paint 1.432 sLCP <P> 1.432 sFully Loaded 1.436 sVisual Complete 99% 1.466 sLast Visual Change 1.500 s
The coach helps you find performance problems on your web page using web performance best practice rules. And gives you advice on privacy and best practices. Tested using Coach-core version 8.1.1.

| Title | Advice | Score | ||||||
|---|---|---|---|---|---|---|---|---|
| Have a fast first contentful paint (firstContentfulPaint) | First contentful paint can be improved (1.928 s). It is in the Google Web Vitals needs improvement range, slower than 1.8 seconds. | 50 | ||||||
| Description: The First Contentful Paint (FCP) metric measures the time from when the page starts loading to when any part of the page content is rendered on the screen. For this metric, "content" refers to text, images (including background images), <svg> elements, or non-white <canvas> elements. | ||||||||
| Avoid CPU Long Tasks (longTasks) | The page has 1 CPU long task with the total of 123 ms. The total blocking time is 0 ms and 1 long task before first contentful paint with total time of 123 ms. However the CPU Long Task is depending on the computer/phones actual CPU speed, so you should measure this on the same type of the device that your user is using. Use Geckoprofiler for Firefox or Chromes tracelog to debug your long tasks. | 80 | ||||||
| Description: Long CPU tasks locks the thread. To the user this is commonly visible as a "locked up" page where the browser is unable to respond to user input; this is a major source of bad user experience on the web today. However the CPU Long Task is depending on the computer/phones actual CPU speed, so you should measure this on the same type of the device that your user is using. To debug you should use the Chrome timeline log and drag/drop it into devtools or use Firefox Geckoprofiler. | ||||||||
| Offenders: | ||||||||
| Long cache headers is good (cacheHeadersLong) | The page has 8 requests that have a shorter cache time than 30 days (but still a cache time). | 92 | ||||||
| Description: Setting a cache header is good. Setting a long cache header (at least 30 days) is even better beacause then it will stay long in the browser cache. But what do you do if that asset change? Rename it and the browser will pick up the new version. | ||||||||
| Offenders: | ||||||||
| Total JavaScript size shouldn't be too big (javascriptSize) | The total JavaScript transfer size is 164.5 kB and the uncompressed size is 507.4 kB. This is quite large. | 0 | ||||||
| Description: A lot of JavaScript often means you are downloading more than you need. How complex is the page and what can the user do on the page? Do you use multiple JavaScript frameworks? | ||||||||
Offenders:
| ||||||||
| Make each CSS response small (optimalCssSize) | https://query.wikidata.org/querybuilder/assets/index.81b2e6d1.css size is 20.1 kB (20077) and that is bigger than the limit of 14.5 kB. Try to make the CSS files fit into 14.5 KB. | 90 | ||||||
| Description: Make CSS responses small to fit into the magic number TCP window size of 14.5 KB. The browser can then download the CSS faster and that will make the page start rendering earlier. | ||||||||
Offenders:
| ||||||||
| Title | Advice | Score |
|---|---|---|
| Meta description (metaDescription) | The page is missing a meta description. | 0 |
| Description: Use a page description to make the page more relevant to search engines. | ||
| Avoid unnecessary headers (unnecessaryHeaders) | There are 10 responses that sets a server header. | 90 |
| Description: Do not send headers that you don't need. We look for p3p, cache-control and max-age, pragma, server and x-frame-options headers. Have a look at Andrew Betts - Headers for Hackers talk as a guide https://www.youtube.com/watch?v=k92ZbrY815c or read https://www.fastly.com/blog/headers-we-dont-want. | ||
| Offenders: | ||
| Title | Advice | Score |
|---|---|---|
| Use a good Content-Security-Policy header to make sure you you avoid Cross Site Scripting (XSS) attacks. (contentSecurityPolicyHeader) | Set a Content-Security-Policy header to make sure you are not open for Cross Site Scripting (XSS) attacks. You can start with setting a Content-Security-Policy-Report-Only header, that will only report the violation, not stop the download. | 0 |
| Description: Content Security Policy is delivered via a HTTP response header, and defines approved sources of content that the browser may load. It can be an effective countermeasure to Cross Site Scripting (XSS) attacks and is also widely supported and usually easily deployed. https://scotthelme.co.uk/content-security-policy-an-introduction/. | ||
| Offenders: | ||
| Set a referrer-policy header to make sure you do not leak user information. (referrerPolicyHeader) | Set a referrer-policy header to make sure you do not leak user information. | 0 |
| Description: Referrer Policy is a new header that allows a site to control how much information the browser includes with navigations away from a document and should be set by all sites. https://scotthelme.co.uk/a-new-security-header-referrer-policy/. | ||
| Offenders: | ||
| Page info | |
|---|---|
| Title | Wikidata Query Builder |
| Width | 1904 |
| Height | 1262 |
| DOM elements | 958 |
| Avg DOM depth | 12 |
| Max DOM depth | 25 |
| Iframes | 0 |
| Script tags | 1 |
| Local storage | 0 b |
| Session storage | 0 b |
| Network Information API | 3g |
Data collected using Wappalyzer version 6.10.66. With updated code from Webappanalyzer 2024-12-27. Use --browsertime.firefox.includeResponseBodies htmlor --browsertime.chrome.includeResponseBodies htmlto help Wappalyzer find more information about technologies used.
| Technology | Confidence | Category |
|---|---|---|
| Debian | 100 | Operating systems |
| Apache HTTP Server 2.4.59 | 100 | Web servers |
| HSTS | 100 | Security |
Data from run 2
| Visual Metrics | |
|---|---|
| First Visual Change | 1.400 s |
| Speed Index | 1.401 s |
| LargestContentfulPaint | 1.400 s |
| Last Meaningful Paint | 1.400 s |
| Largest Contentful Paint | 1.400 s |
| Visual Complete 85% | 1.400 s |
| Visual Complete 95% | 1.400 s |
| Visual Complete 99% | 1.466 s |
| Last Visual Change | 1.500 s |
| Visual Readiness | 100 ms |
| Navigation Timing | |
|---|---|
| backEndTime | 658 ms |
| domContentLoadedTime | 1.115 s |
| domInteractiveTime | 668 ms |
| domainLookupTime | 106 ms |
| frontEndTime | 456 ms |
| pageDownloadTime | 1 ms |
| pageLoadTime | 1.115 s |
| redirectionTime | 0 ms |
| serverConnectionTime | 201 ms |
| serverResponseTime | 347 ms |
| Google Web Vitals | |
|---|---|
| Time to first byte (TTFB) | 658 ms |
| First Contentful Paint (FCP) | 1.432 s |
| Largest Contentful Paint (LCP) | 1.432 s |
| Interaction to next paint (INP) | 616 ms |
| Total Blocking Time (TBT) | 0 ms |
| First Contentful Paint info | |
|---|---|
| Elements that needed recalculate style before FCP | 455 |
| Time spent in recalculate style before FCP | 24.007 ms |
| Extra timings | |
|---|---|
| TTFB | 658 ms |
| First Paint | 1.432 s |
| Load Event End | 1.116 s |
| Fully loaded | 1.436 s |
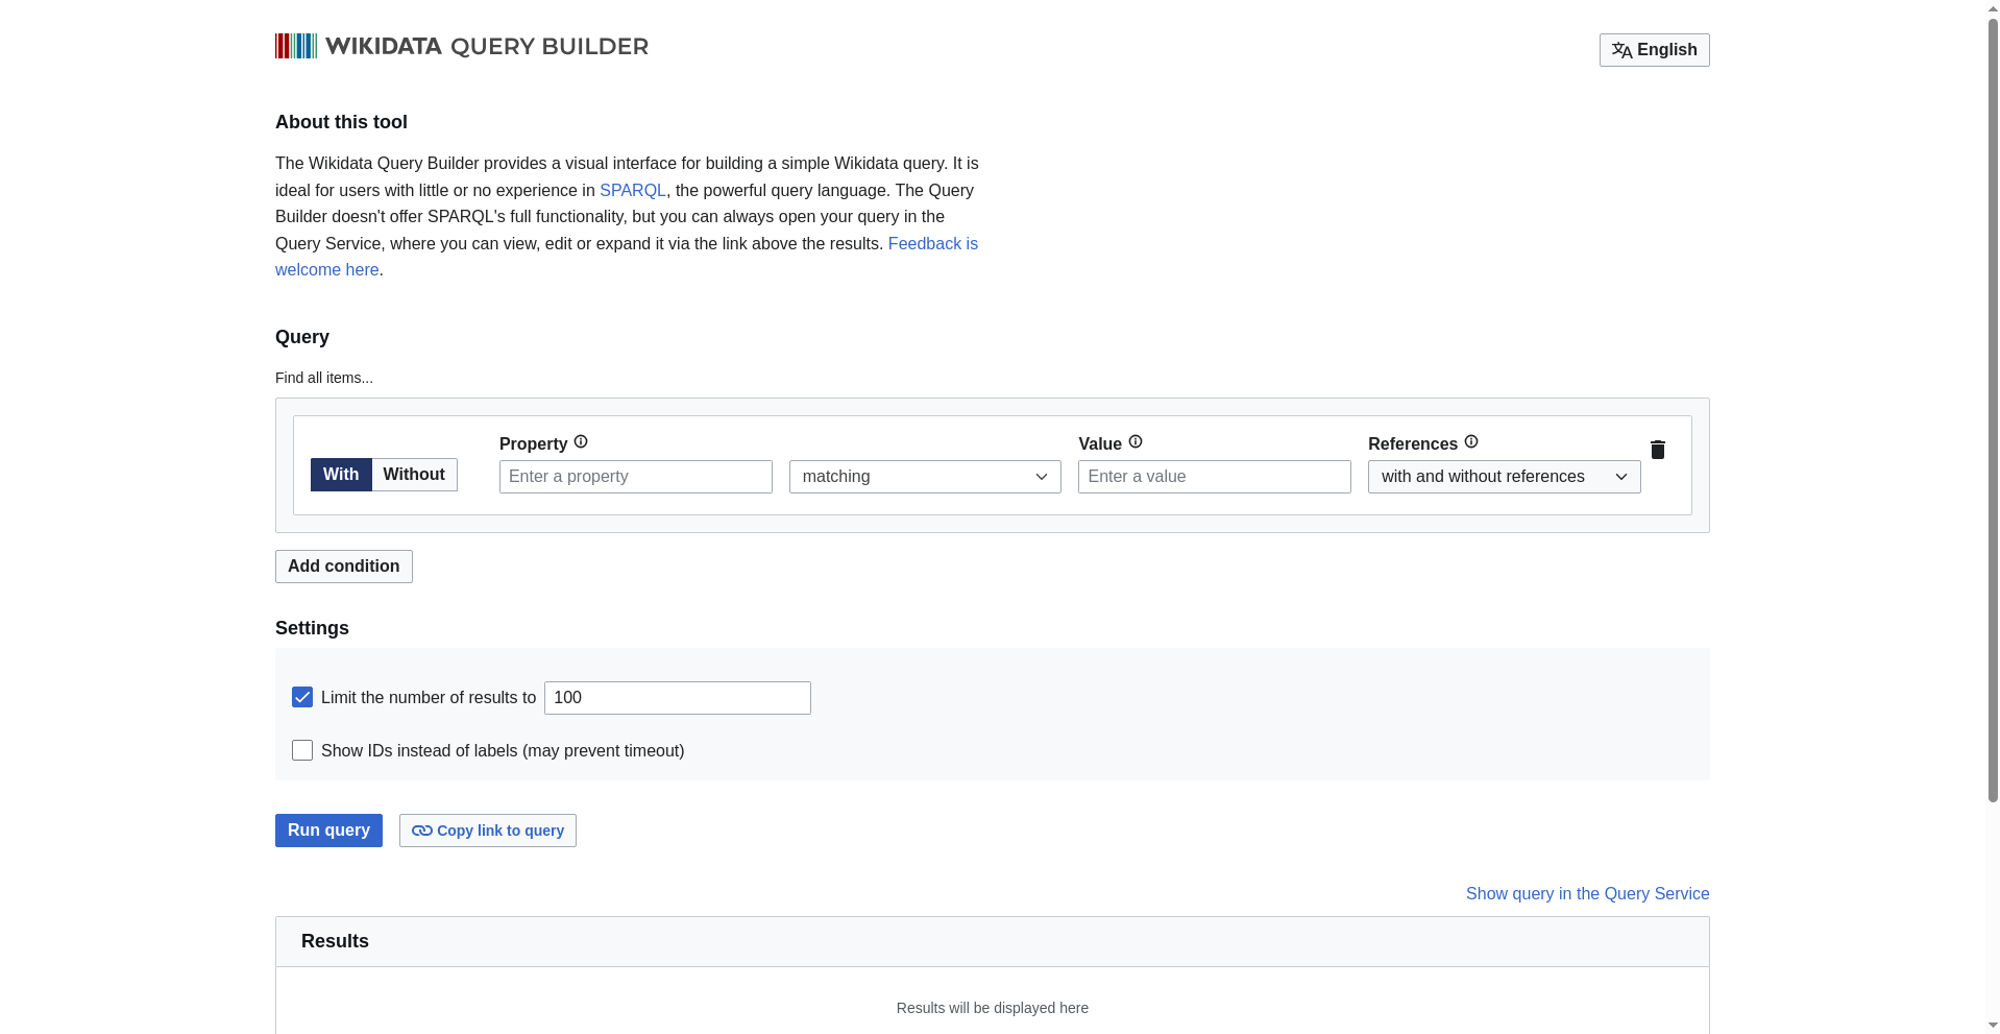
When in time the page main content is rendered (collected using the Largest Contentful Paint API). Read more about Largest Contentful Paint.
| Element type | P |
| Element/tag | <p class="querybuilder__description"></p> |
| Render time | 1.432 s |
| Element render delay | 774 ms |
| TTFB | 658 ms |
| Resource delay | 0 ms |
| Resource load duration | 0 ms |
| Elements that needed recalculate style before LCP | 455 |
| Time spent in recalculate style before LCP | 24.007 ms |
| Load time | 0 ms |
| Size (width*height) | 80444 |
| DOM path | |
| div#app > div#app > div > main > p> div#app > div#app > div > main > p> | |
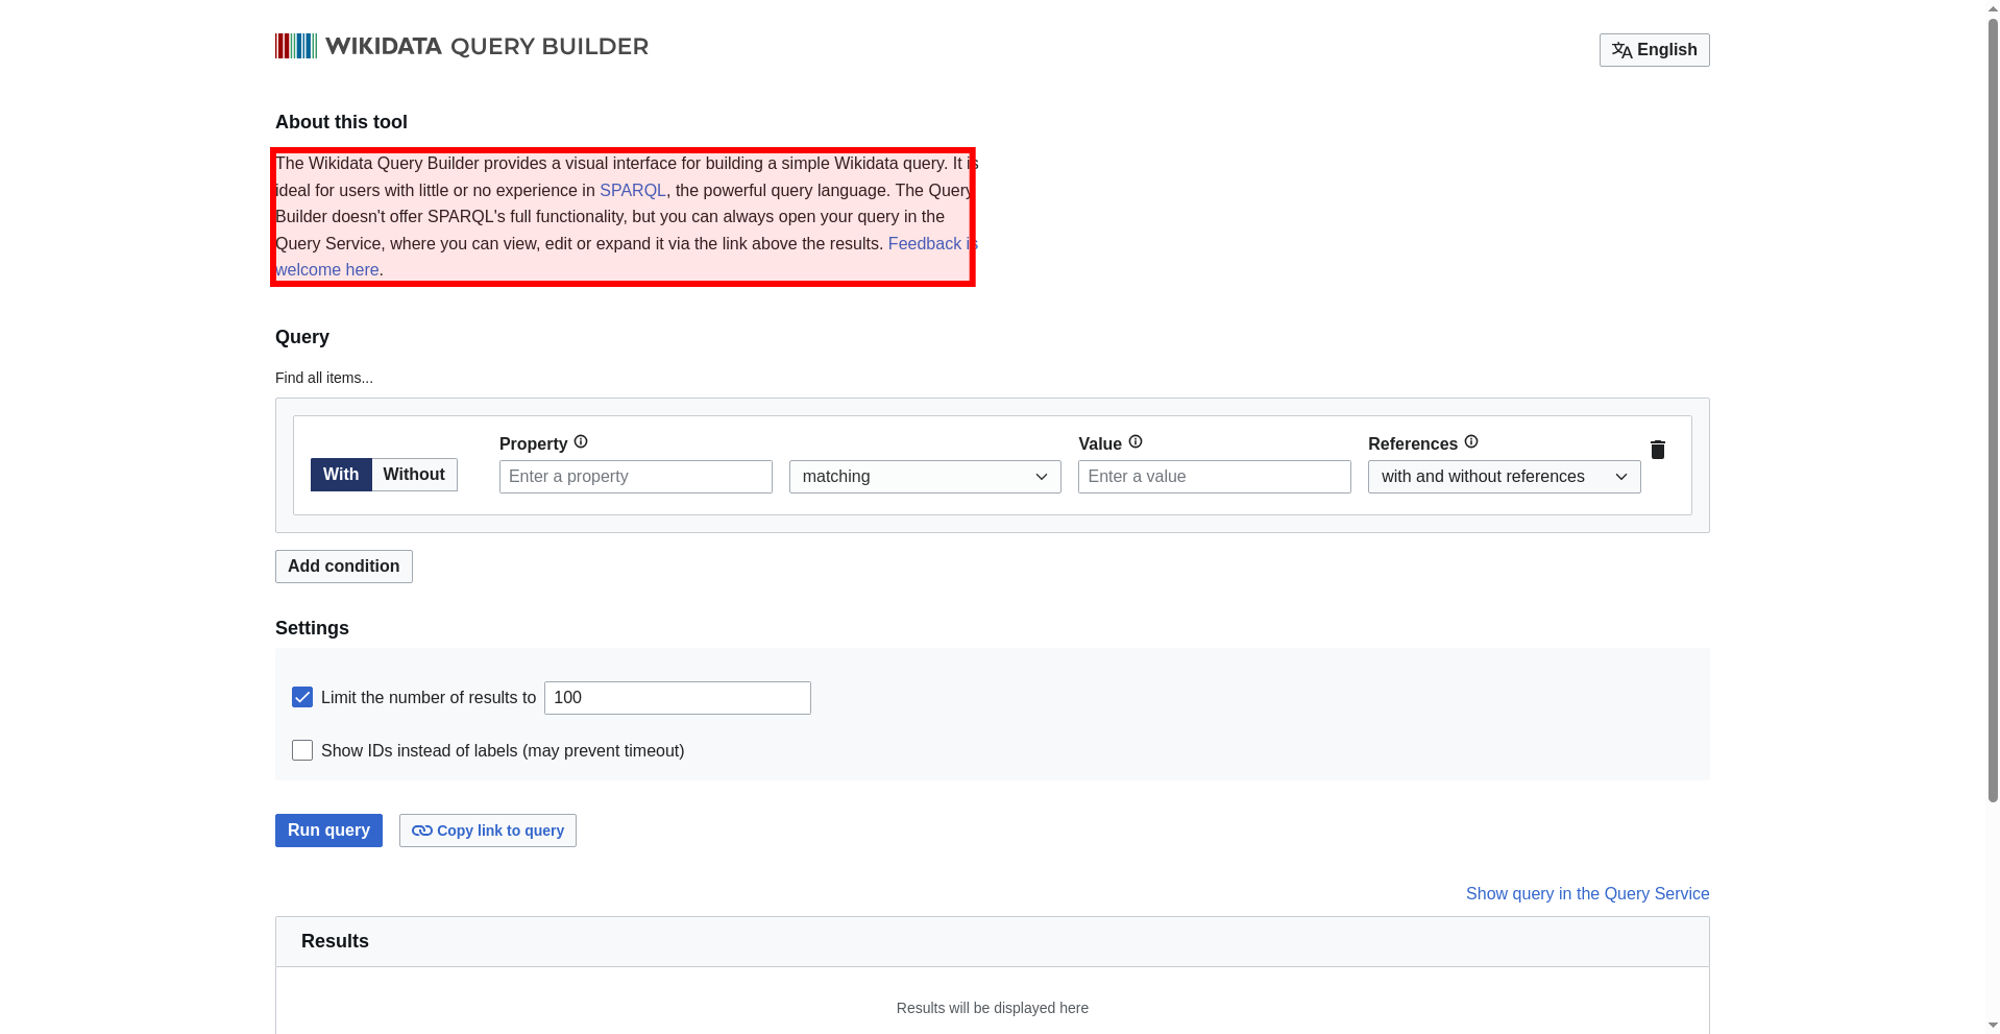
The largest contentful paint is highlighted in the image. If no element is highlighted the element was removed before the screenshot or the LCP API couldn't find the element.
No layout shift detected.
Interaction to Next Paint (INP) is a metric that try to measure responsiveness. It's useful if you are testing user journeys. Read more about Interaction to Next Paint.
The measured latency was 616 ms.
| Event type | pointerover |
| Element type | HTML |
| Element class name | |
| Event target | html |
| Load state when the event happened | dom-interactive |
Read more about the Long Animation Frames API here here.
The top 10 longest animation frames entries
| Blocking duration | Work duration | Render duration | PreLayout Duration | Style And Layout Duration |
|---|---|---|---|---|
| 81.5 ms | 141.3 ms | 1.4 ms | 1.1 ms | 0.3 ms |
| https://query.wikidata.org/querybuilder/assets/index.727c9d3b.js | ||||
Invoker: Response.json.then | ||||
| https://query.wikidata.org/querybuilder/assets/index.727c9d3b.js | ||||
Forced Style And Layout Duration: 40 ms Invoker: Response.json.then | ||||
| Blocking duration | Work duration | Render duration | PreLayout Duration | Style And Layout Duration |
|---|---|---|---|---|
| 0 ms | 146.4 ms | 1.2 ms | 0.1 ms | 1.1 ms |
| No availible script information. | ||||
| name | duration | description |
|---|---|---|
| cache | 0 | pass |
| host | 0 | cp3067 |
There are no custom configured scripts.
There are no custom extra metrics from scripting.
| Name | Display Time | X | Y | Width | Height |
|---|---|---|---|---|---|
| Heading | 264 | 56 | 1 | 1 | |
| <h1 class="visually-hidden"></h1> | |||||
| LargestContentfulPaint | 1.400 s | 264 | 144 | 676 | 128 |
| <p class="querybuilder__description"></p> | |||||
How the page is built.
| Summary | |
|---|---|
| HTTP version | HTTP/2.0 |
| Total requests | 10 |
| Total domains | 2 |
| Total transfer size | 197.9 KB |
| Total content size | 699.0 KB |
| Responses missing compression | 5 |
| Number of cookies | 1 |
| Third party cookies | 0 |
| Requests per response code | |
|---|---|
| 200 | 9 |
| 204 | 1 |
| URL | Type | Transfer Size | Content Size |
|---|---|---|---|
| https://query.wikida...index.727c9d3b.js | javascript | 160.6 KB | 495.5 KB |
| https://query.wikida...ndex.81b2e6d1.css | css | 19.6 KB | 169.9 KB |
| https://query.wikidata.org/favicon.ico | favicon | 5.5 KB | 14.7 KB |
| https://query.wikida...r/img/QB_Logo.svg | svg | 3.9 KB | 7.6 KB |
| https://query.wikida...lder/i18n/en.json | json | 2.8 KB | 7.4 KB |
| https://query.wikidata.org/querybuilder/ | html | 1.7 KB | 2.2 KB |
| https://query.wikida...der/img/clear.svg | svg | 1.1 KB | 1.0 KB |
| https://query.wikida...er/img/search.svg | svg | 1014 B | 494 B |
| https://query.wikida...der/img/close.svg | svg | 909 B | 321 B |
| https://www.wikidata...org/beacon/statsv | plain | 754 B | 0 b |
| Content | Header Size | Transfer Size | Content Size | Requests |
|---|---|---|---|---|
| html | 0 b | 1.7 KB | 2.2 KB | 1 |
| css | 0 b | 19.6 KB | 169.9 KB | 1 |
| javascript | 0 b | 160.6 KB | 495.5 KB | 1 |
| json | 0 b | 2.8 KB | 7.4 KB | 1 |
| favicon | 0 b | 5.5 KB | 14.7 KB | 1 |
| plain | 0 b | 754 B | 0 b | 1 |
| svg | 0 b | 6.9 KB | 9.4 KB | 4 |
| Total | 0 b | 197.9 KB | 699.0 KB | 10 |
| Domain | Total download time | Transfer Size | Content Size | Requests |
|---|---|---|---|---|
| query.wikidata.org | 3.886 s | 197.2 KB | 699.0 KB | 9 |
| www.wikidata.org | 207 ms | 754 B | 0 b | 1 |
| type | min | median | max |
|---|---|---|---|
| Expires | 0 seconds | 1 hour | 1 hour |
| Last modified | 3 days | 4 weeks | 4 weeks |
Included requests done after load event end.
| Content | Transfer Size | Requests |
|---|---|---|
| html | 0 b | 0 |
| css | 0 b | 0 |
| javascript | 0 b | 0 |
| image | 0 b | 0 |
| font | 0 b | 0 |
| json | 2.8 KB | 1 |
| favicon | 5.5 KB | 1 |
| plain | 754 B | 1 |
| svg | 6.9 KB | 4 |
| Total | 16.0 KB | 7 |
Includes requests done after DOM content loaded.
| Content | Transfer Size | Requests |
|---|---|---|
| html | 0 b | 0 |
| css | 0 b | 0 |
| javascript | 0 b | 0 |
| image | 0 b | 0 |
| font | 0 b | 0 |
| json | 2.8 KB | 1 |
| favicon | 5.5 KB | 1 |
| plain | 754 B | 1 |
| svg | 6.9 KB | 4 |
| Total | 16.0 KB | 7 |
Render blocking information directly from Chrome.
| Blocking | In body parser blocking | Potentially blocking |
|---|---|---|
| 1 | 0 | 0 |
| URL | Type |
|---|---|
| https://query.wikida...index.727c9d3b.js | non_blocking |
| https://query.wikida...ndex.81b2e6d1.css | blocking |
Download the Chrome trace log and drag and drop it into Developer Tools / Performance in Chrome.
Collected using the Long Task API. A long task is a task that take 50 milliseconds or more.
| Type | Quantity | Total duration (ms) |
|---|---|---|
| Total Blocking Time | 0 | |
| Max Potential First Input Delay | 0 | |
| Long Tasks before First Paint | 1 | 130 |
| Long Tasks before First Contentful Paint | 1 | 130 |
| Long Tasks before Largest Contentful Paint | 1 | 130 |
| Long Tasks after Load Event End | 1 | 130 |
| Total Long Tasks | 1 | 130 |
CPU last long task happened at 1.228 s
| name | startTime | duration | containerId | containerName | containerSrc | containerType |
|---|---|---|---|---|---|---|
| unknown | 1228 | 130 | window |
Calculated using Tracium.
| Categories (ms) | |
|---|---|
| parseHTML | 10 |
| styleLayout | 45 |
| paintCompositeRender | 4 |
| scriptParseCompile | 1 |
| scriptEvaluation | 110 |
| garbageCollection | 4 |
| other | 66 |
| Events (ms) | |
|---|---|
| RunMicrotasks | 86 |
| RunTask | 45 |
| UpdateLayoutTree | 25 |
| Layout | 20 |
| v8.evaluateModule | 16 |
| CpuProfiler::StartProfiling | 11 |