Tested 2026-05-26 05:27:15 using Chrome 148.0.7778.96 (runtime settings)
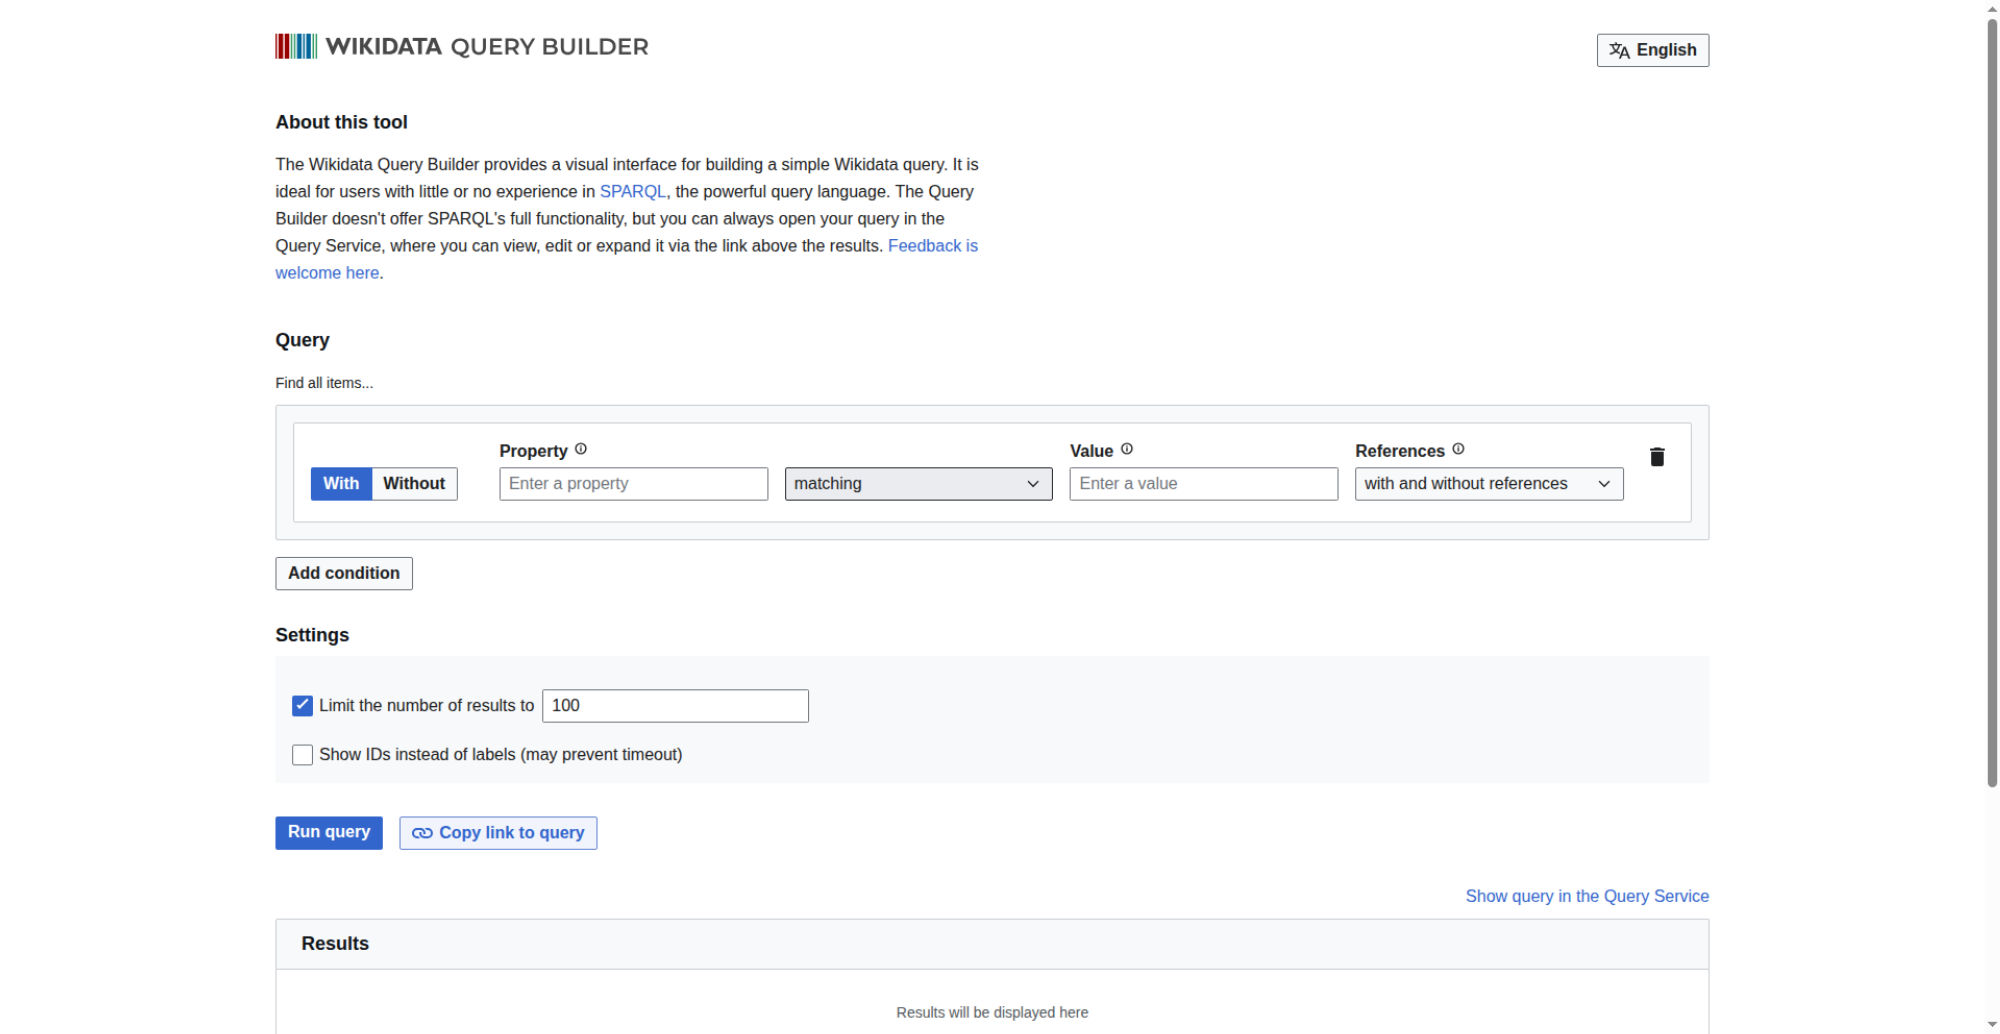
| Metric | min | median | mean | max |
|---|---|---|---|---|
| Visual Metrics | ||||
| FirstVisualChange | 1.400 s | 1.433 s | 1.513 s | 1.900 s |
| LastVisualChange | 1.466 s | 1.500 s | 1.640 s | 2.200 s |
| SpeedIndex | 1.402 s | 1.435 s | 1.517 s | 1.908 s |
| LargestContentfulPaint | 1.400 s | 1.433 s | 1.513 s | 1.900 s |
| LastMeaningfulPaint | 1.400 s | 1.433 s | 1.513 s | 1.900 s |
| VisualReadiness | 66 ms | 100 ms | 127 ms | 300 ms |
| VisualComplete85 | 1.400 s | 1.433 s | 1.513 s | 1.900 s |
| VisualComplete95 | 1.400 s | 1.433 s | 1.513 s | 1.900 s |
| VisualComplete99 | 1.466 s | 1.500 s | 1.640 s | 2.200 s |
| Google Web Vitals | ||||
| Time To First Byte (TTFB) | 637 ms | 639 ms | 640 ms | 643 ms |
| Largest Contentful Paint (LCP) | 1.404 s | 1.428 s | 1.516 s | 1.900 s |
| Cumulative Layout Shift (CLS) | 0 | 0 | 0 | 0 |
| More metrics | ||||
| firstPaint | 1.404 s | 1.428 s | 1.516 s | 1.900 s |
| loadEventEnd | 1.102 s | 1.107 s | 1.158 s | 1.366 s |
| CPU | ||||
| Total Blocking Time | 0 ms | 0 ms | 0 ms | 0 ms |
| Max Potential FID | 0 ms | 0 ms | 0 ms | 0 ms |
| CPU long tasks | 1 | 1 | 1 | 1 |
| CPU last long task happens at | 1.217 s | 1.222 s | 1.324 s | 1.735 s |
Run 2 SpeedIndex median
Use --filmstrip.showAll to show all filmstrips.
 0 s1.2 sDOM Content Loaded Time 1.107 sPage Load Time 1.107 s1.3 sCPU Long Task duration 135 ms
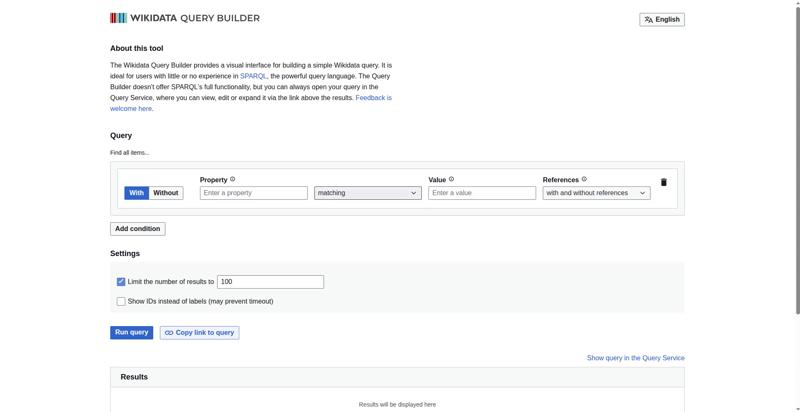 1.5 sFully Loaded 1.424 sFirst Contentful Paint 1.432 sLCP <P> 1.432 sFirst Visual Change 1.433 sVisual Complete 85% 1.433 sVisual Complete 95% 1.433 s
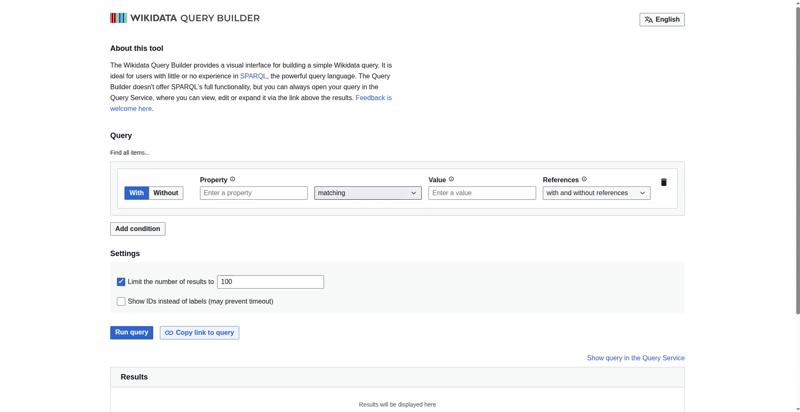 1.6 sLast Visual Change 1.533 sVisual Complete 99% 1.533 s
The coach helps you find performance problems on your web page using web performance best practice rules. And gives you advice on privacy and best practices. Tested using Coach-core version 9.2.1.
decodingAsyncThe page has 3 images (out of 3) without a decoding hint. Add decoding="async" to non-critical images so the browser can decode them off the main thread.
Setting decoding="async" on an <img> tells the browser it can decode the image off the main thread, which keeps the page responsive to user interactions while images are being processed. The default ("auto") leaves the choice to the browser. https://developer.mozilla.org/en-US/docs/Web/HTML/Element/img#decoding
firstContentfulPaintFirst contentful paint can be improved (1.900 s). It is in the Google Web Vitals needs improvement range, slower than 1.8 seconds.
The First Contentful Paint (FCP) metric measures the time from when the page starts loading to when any part of the page content is rendered on the screen. For this metric, "content" refers to text, images (including background images), <svg> elements, or non-white <canvas> elements.
longTasksThe page has 1 CPU long task with the total of 124 ms. The total blocking time is 0 ms and 1 long task before first contentful paint with total time of 124 ms. However the CPU Long Task is depending on the computer/phones actual CPU speed, so you should measure this on the same type of the device that your user is using. Use Geckoprofiler for Firefox or Chromes tracelog to debug your long tasks.
Long CPU tasks locks the thread. To the user this is commonly visible as a "locked up" page where the browser is unable to respond to user input; this is a major source of bad user experience on the web today. However the CPU Long Task is depending on the computer/phones actual CPU speed, so you should measure this on the same type of the device that your user is using. To debug you should use the Chrome timeline log and drag/drop it into devtools or use Firefox Geckoprofiler.
cacheHeadersLongThe page has 8 requests that have a shorter cache time than one year (but still a cache time).
Setting a cache header is good. Setting a long cache header (a year) is even better because the asset will stay in the browser cache across visits. For content-hashed URLs (e.g. app.4af2.css) you can safely use Cache-Control: max-age=31536000, immutable. For unversioned URLs that may change, use a revalidating strategy instead.
metaDescriptionThe page is missing a meta description.
Use a page description to make the page more relevant to search engines.
unnecessaryHeadersThere are 10 responses that sets a server header.
Do not send headers that you don't need. We look for p3p, cache-control and max-age, pragma, server and x-frame-options headers. Have a look at Andrew Betts - Headers for Hackers talk as a guide https://www.youtube.com/watch?v=k92ZbrY815c or read https://www.fastly.com/blog/headers-we-dont-want.
referrerPolicyNo <meta name="referrer"> tag was found on the page. Set a Referrer-Policy response header (preferred) or add a meta tag, for example <meta name="referrer" content="strict-origin-when-cross-origin">.
Without an explicit referrer policy the browser falls back to the user-agent default and may leak the full URL of the previous page (including query strings) to every cross-origin request. Set a Referrer-Policy response header (preferred) or a <meta name="referrer"> tag in the document. https://developer.mozilla.org/en-US/docs/Web/HTTP/Headers/Referrer-Policy
contentSecurityPolicyHeaderSet a Content-Security-Policy header to mitigate cross-site scripting attacks. You can start with a Content-Security-Policy-Report-Only header, which only reports violations rather than blocking them.
A Content-Security-Policy response header tells the browser which sources of script, style, and other content are allowed. The most effective form is a strict CSP using nonces or hashes together with strict-dynamic; the worst is a missing header, with unsafe-inline and unsafe-eval close behind. https://web.dev/articles/strict-csp
crossOriginEmbedderPolicyHeaderSet a Cross-Origin-Embedder-Policy header (typically require-corp or credentialless) on the document response to control cross-origin embedding.
Cross-Origin-Embedder-Policy (COEP) makes the page refuse to load cross-origin subresources unless they explicitly opt in via CORP or CORS. Together with Cross-Origin-Opener-Policy it puts the page in a cross-origin isolated context, which mitigates cross-window side-channel attacks (Spectre) and unlocks high-resolution timers and SharedArrayBuffer. https://developer.mozilla.org/en-US/docs/Web/HTTP/Headers/Cross-Origin-Embedder-Policy
crossOriginOpenerPolicyHeaderSet a Cross-Origin-Opener-Policy header (typically same-origin) on the document response to isolate the page from cross-origin windows.
Cross-Origin-Opener-Policy (COOP) lets a page sever its window-group ties to cross-origin documents that opened it or that it opens. Together with Cross-Origin-Embedder-Policy it puts the page in a cross-origin isolated context, which mitigates cross-window side-channel attacks (Spectre) and unlocks high-resolution timers and SharedArrayBuffer. https://developer.mozilla.org/en-US/docs/Web/HTTP/Headers/Cross-Origin-Opener-Policy
crossOriginResourcePolicyHeaderSet a Cross-Origin-Resource-Policy header (same-origin, same-site or cross-origin) on the document response to limit who may embed it.
Cross-Origin-Resource-Policy (CORP) is a per-response opt-in that tells the browser which origins are allowed to embed the resource. It blocks cross-origin or cross-site no-cors embedding (img, script, iframe, etc.) and is one of the building blocks of cross-origin isolation. https://developer.mozilla.org/en-US/docs/Web/HTTP/Headers/Cross-Origin-Resource-Policy
permissionsPolicyHeaderSet a Permissions-Policy header to control which browser features the page can use.
The Permissions-Policy response header (the successor to Feature-Policy) lets a site explicitly opt in or out of powerful browser features such as camera, microphone, geolocation, payment and clipboard. Setting a strict policy reduces the attack surface and limits what embedded third parties can do. https://developer.mozilla.org/en-US/docs/Web/HTTP/Headers/Permissions-Policy
referrerPolicyHeaderSet a referrer-policy header to make sure you do not leak user information.
Referrer Policy is a new header that allows a site to control how much information the browser includes with navigations away from a document and should be set by all sites. https://scotthelme.co.uk/a-new-security-header-referrer-policy/.
xContentTypeOptionsHeaderSet X-Content-Type-Options: nosniff on the document response to prevent MIME-sniffing.
X-Content-Type-Options: nosniff prevents browsers from interpreting files as a different MIME type than what is declared in the Content-Type header. This blocks a class of cross-site scripting and content-type confusion attacks and should be set on every response. https://developer.mozilla.org/en-US/docs/Web/HTTP/Headers/X-Content-Type-Options
Data collected using
Coach-core version 9.2.1. With updated code from
Webappanalyzer 2026-05-04. Use
--browsertime.firefox.includeResponseBodies html or
--browsertime.chrome.includeResponseBodies html to help Wappalyzer find more information about technologies used.
Data from run 2
0.0s1.2s1.3s1.5s1.6sWhen the page main content is rendered, collected via the Largest Contentful Paint API. Read more about Largest Contentful Paint.
body > div#app > div#app > div > main > p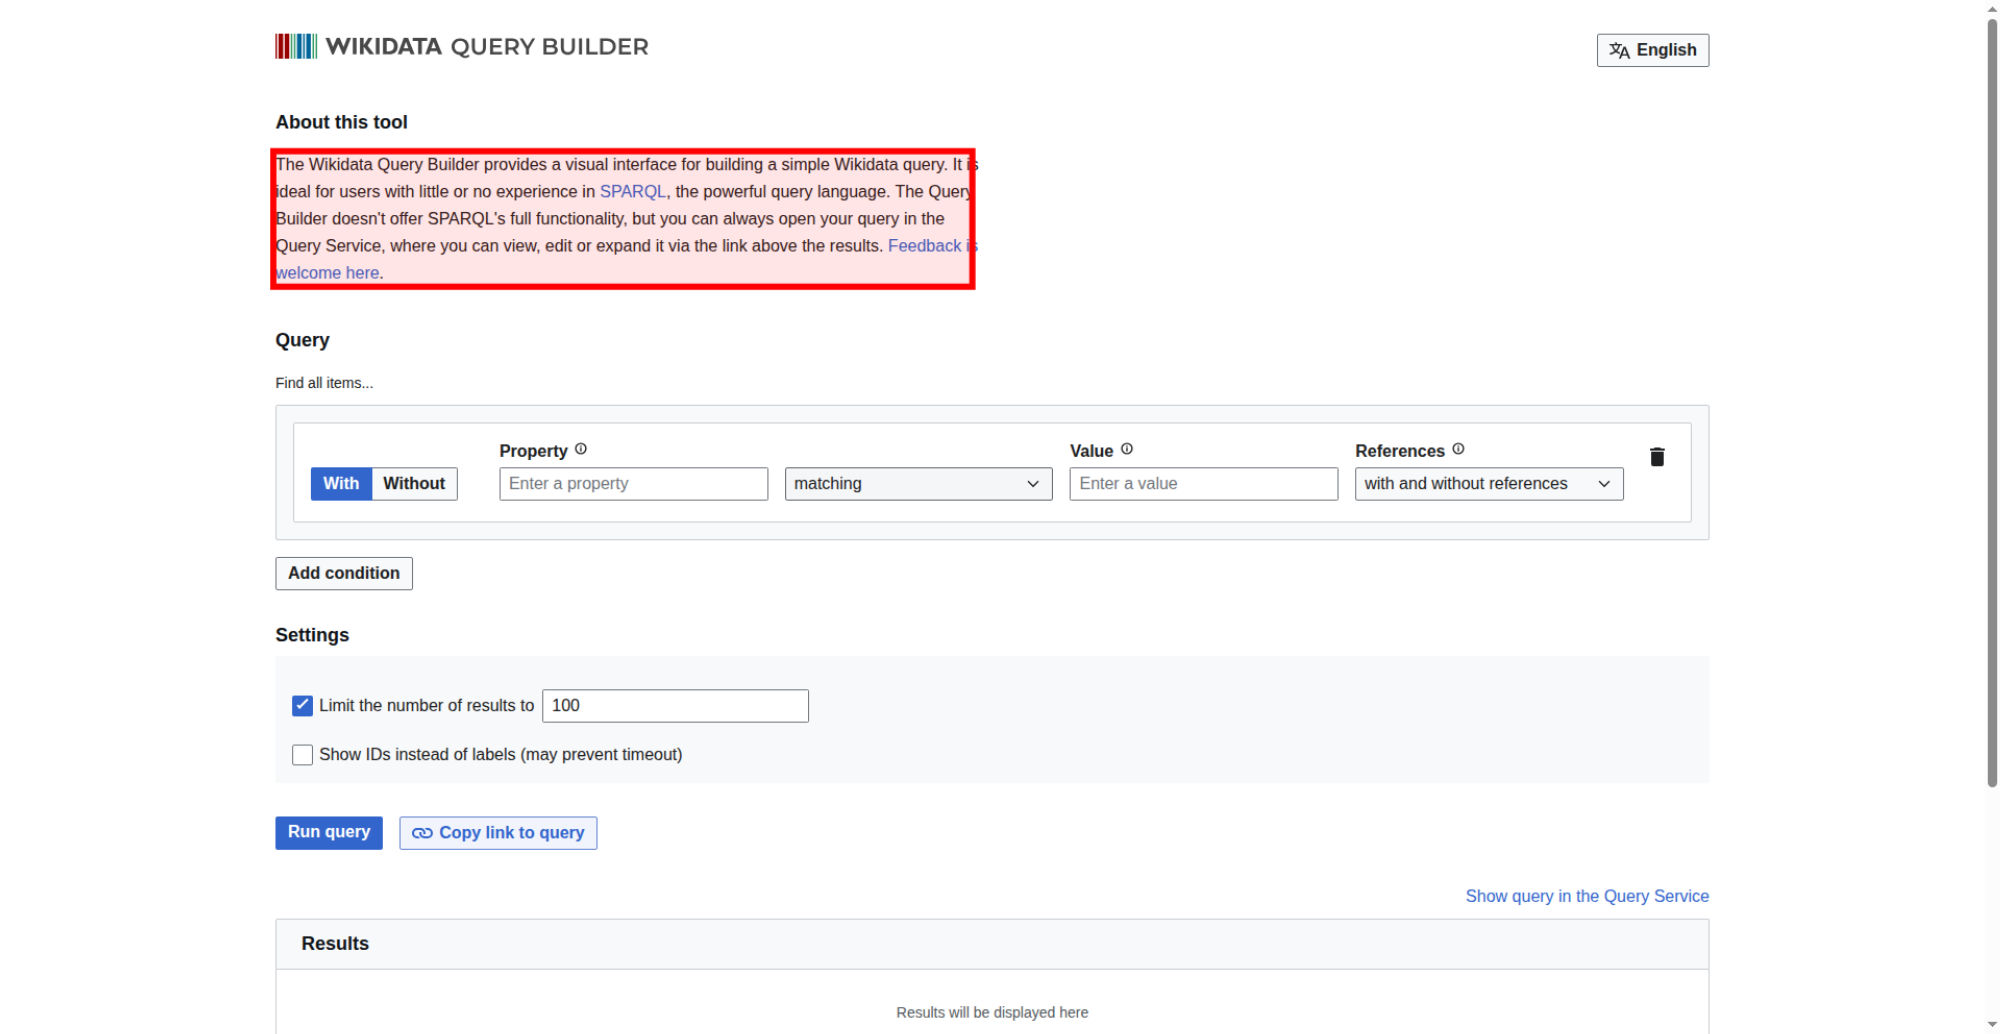
The LCP element is highlighted in the screenshot. If nothing is highlighted the element was removed before the screenshot or the LCP API couldn't find it.
How much the page's content shifts as it loads, collected via the Cumulative Layout Shift API.
No layout shifts were detected on this page.
A long animation frame (LOAF) is a frame that took ≥ 50 ms from input to the next paint. The breakdown shows where that time went. Read more about the Long Animation Frames API.
Showing the top 10 longest animation frames.
No script attribution available for this frame.
| Name | Duration | Description |
|---|---|---|
cache | 0 ms | pass |
host | 0 ms | cp3070 |
There are no custom configured scripts.
There are no custom extra metrics from scripting.
How the page is built.
| URL | Type | Transfer Size | Content Size |
|---|---|---|---|
| https://query.wikida...index.97f88779.js | javascript | 169.5 KB | 524.2 KB |
| https://query.wikida...ndex.58783912.css | css | 23.8 KB | 218.3 KB |
| https://query.wikidata.org/favicon.ico | favicon | 5.6 KB | 14.7 KB |
| https://query.wikida...r/img/QB_Logo.svg | svg | 4.0 KB | 7.6 KB |
| https://query.wikida...lder/i18n/en.json | json | 2.9 KB | 7.4 KB |
| https://query.wikidata.org/querybuilder/ | html | 1.9 KB | 2.2 KB |
| https://query.wikida...der/img/clear.svg | svg | 1.2 KB | 1.0 KB |
| https://query.wikida...er/img/search.svg | svg | 1.1 KB | 494 B |
| https://query.wikida...der/img/close.svg | svg | 974 B | 321 B |
| https://www.wikidata...org/beacon/statsv | plain | 819 B | 0 b |
| Content | Header Size | Transfer Size | Content Size | Requests |
|---|---|---|---|---|
| html | 0 b | 1.9 KB | 2.2 KB | 1 |
| css | 0 b | 23.8 KB | 218.3 KB | 1 |
| javascript | 0 b | 169.5 KB | 524.2 KB | 1 |
| favicon | 0 b | 5.6 KB | 14.7 KB | 1 |
| json | 0 b | 2.9 KB | 7.4 KB | 1 |
| plain | 0 b | 819 B | 0 b | 1 |
| svg | 0 b | 7.1 KB | 9.4 KB | 4 |
| Total | 0 b | 211.6 KB | 776.2 KB | 10 |
| Domain | Total download time | Transfer Size | Content Size | Requests |
|---|---|---|---|---|
| query.wikidata.org | 3.760 s | 210.8 KB | 776.2 KB | 9 |
| www.wikidata.org | 185 ms | 819 B | 0 b | 1 |
| type | min | median | max |
|---|---|---|---|
| Expires | 0 seconds | 1 hour | 1 hour |
| Last modified | 5 weeks | 45 weeks | 45 weeks |
Includes requests done after load event end.
| Content | Transfer Size | Requests |
|---|---|---|
| html | 0 b | 0 |
| css | 0 b | 0 |
| javascript | 0 b | 0 |
| image | 0 b | 0 |
| font | 0 b | 0 |
| favicon | 5.6 KB | 1 |
| plain | 819 B | 1 |
| svg | 7.1 KB | 4 |
| Total | 13.5 KB | 6 |
Includes requests done after DOM content loaded.
| Content | Transfer Size | Requests |
|---|---|---|
| html | 0 b | 0 |
| css | 0 b | 0 |
| javascript | 0 b | 0 |
| image | 0 b | 0 |
| font | 0 b | 0 |
| favicon | 5.6 KB | 1 |
| plain | 819 B | 1 |
| svg | 7.1 KB | 4 |
| Total | 13.5 KB | 6 |
Render blocking information directly from Chrome.
| Blocking | In body parser blocking | Potentially blocking |
|---|---|---|
| 1 | 0 | 0 |
| URL | Type |
|---|---|
| https://query.wikida...index.97f88779.js | non_blocking |
| https://query.wikida...ndex.58783912.css | blocking |
Download the Chrome trace and drag-and-drop it into Performance in DevTools.
Tasks ≥ 50 ms blocking the main thread, collected via the Long Task API.
How much each script blocked the main thread, derived from the Long Animation Frame API. The script that started each long frame is credited with the frame's blocking time — the closest answer to "which script should I fix to improve TBT" the platform exposes.
Calculated from the Chrome trace.
A forced reflow happens when JavaScript reads a layout-triggering property (offsetTop, getBoundingClientRect, …) inside a handler, forcing the browser to synchronously recompute layout. The scripts below caused most of the page's reflows — fix them in priority order.
Each long animation frame reports how much time each script spent forcing synchronous style and layout — i.e. JavaScript reading layout-triggering properties mid-execution. Same actionable answer as forced reflows above but measured directly by the browser instead of inferred from the trace.
Animations that fell back from the compositor to the main thread, blocking each frame instead of running on the GPU. Each chip below is a CSS property the page tried to animate that Chrome couldn't hand to the compositor — swap it for a transform or opacity equivalent where you can.
border-bottom-color2×border-left-color2×border-right-color2×border-top-color2×color2×box-shadow1×