https://vi.wikipedia.org/wiki/Vincent_van_Gogh
Tested 2026-07-28 00:13:30 using Chrome 150.0.7871.186 (runtime settings)

The red band on the timeline marks when the main thread was busy with long tasks: moments when the page could not paint or respond, however the video looks.
Download videoUse --filmstrip.showAll to show all filmstrips.





Click a frame to seek the video to that moment. The dot marks frames where the page changed visually.

The whole recording in one image: every pixel is tinted by how often it changed. Amber changed once, deep red changed ten or more times. The scale is fixed, so heatmaps from different runs compare directly.
Flat amber is a page that painted once and stayed put. Red speckle in the shape of the text means the same pixels repainted over and over, usually invisible rendering noise that inflates Last Visual Change and Speed Index. A solid red block is a genuinely restless area, like an ad or a carousel.
How smoothly Chrome delivered frames to the screen during the test. Dropped counts only frames Chrome flags as affecting smoothness. On mostly-static pages the longest gap includes idle time where there was simply nothing to draw.
Rendering was not meaningfully delayed. First paint landed at 1.100 s on a 402 ms first byte; the 3 render-blocking requests were done by 730 ms and the remaining ~370 ms is style and layout work (125 ms of it measured style recalculation).
Style the browser had to recalculate before it could paint: many elements or a lot of time spent here points at expensive CSS on the critical rendering path. The recalculation count and the largest single one tell the two problems apart: one massive style change touching most of the page (few recalculations, the largest close to the total) needs different medicine than thousands of tiny ones (many recalculations, each tiny).
One large recalculation dominates. Restyling 562 elements cost 125 ms before the page painted (11.3 % of the time to First Contentful Paint), and a single recalculation of 559 elements accounts for 121 ms of it. Look for one class or inline-style change on a large container near the top of the DOM that restyles the whole subtree at once. The changes driving it are listed under Style invalidations below.
The recalculation work before first paint is 11.3 % of the time to First Contentful Paint.
Blocking requests delay both paints: the browser renders nothing until they arrive, so they push First Contentful Paint and everything after it, including the largest paint (LCP). Requests that block the parser inside the body stall everything after them in the document. Load JavaScript with defer or async, and keep non-critical CSS off the critical path with media attributes. Bars show when each request loaded on a clock that runs to the last paint; the gap after the bars is style and layout work.
| Request | When it loaded | Transfer | Download |
|---|---|---|---|
document | 673 ms | 125.7 KB | 672 ms |
site.stylesblocking | 266 ms | 1.6 KB | 266 ms |
ext.gadget.charinsert-stylesblocking | 265 ms | 1.3 KB | 265 ms |
240 ms | 23.6 KB | 240 ms | |
startuppotentially blocking | 264 ms | 21.1 KB | 264 ms |
0275 ms550 msFCP · LCP 1.100 s |
Why the browser had to recalculate style and layout: every DOM/style change invalidates some set of nodes, and the same class or attribute churning over and over is the pattern to hunt. Counts, not milliseconds: the time is in the style recalculation numbers above.
Chase what keeps changing after the page is up. 321 style recalculations and 330 layout invalidations fired after first paint, on a page the user was already looking at. The biggest driver is attribute title (109×). Start with the script under "Scripts causing invalidations" that keeps triggering it.
attribute: title109×pseudo: has36×class: mf-collapsible-heading18×class: mf-collapsible-content9×attribute: style7×pseudo: disabled2×pseudo: enabled2×attribute: disabled1×class: content1×class: touch-events1×attribute: href1×pseudo: link1×pseudo: visited1×class: minerva-animations-ready1×class: page-actions-menu__list-item1×Invalidations on a page the user was already looking at, the actionable half.
| Reason | Style recalculations | Layout |
|---|---|---|
| A :has() selector was re-evaluated:has() re-checks a whole subtree on any change inside it. Scope it tightly, or toggle a class in JavaScript instead. | 104 | – |
| A node was inserted into the page | 95 | – |
| Related style rule | 84 | – |
| A stylesheet rule changed | 21 | – |
| Attribute | 10 | – |
| JavaScript changed an inline styleSet a class instead of writing element.style, so the browser can batch the work. | 6 | – |
| An animation updated stylesAnimate transform and opacity so the compositor can run it off the main thread. | 1 | – |
| An element entered layout | – | 246 |
| An element left layout | – | 52 |
| Unknown | – | 12 |
| An element's size changed | – | 14 |
| An SVG element changed | – | 4 |
| A style change forced layout | – | 2 |
The page being constructed and styled for the first render. Expected work, shown for scale.
| Reason | Style recalculations | Layout |
|---|---|---|
| A node was inserted into the page | 5 | – |
| A stylesheet rule changed | 1 | – |
| A pseudo-class state changed (:hover, :focus, …) | 1 | – |
| An element entered layout | – | 909 |
| An element left layout | – | 3 |
| Unknown | – | 3 |
| An element's size changed | – | 1 |
1 animation runs on the main thread instead of on the browser's fast path that animates without blocking other page work (the compositor); they can make the rendering you see above janky. See them on the CPU tab.
The coach helps you find performance problems on your web page using web performance best practice rules. And gives you advice on privacy and best practices. Tested using Coach-core version 9.2.1.
longTasksThe page has 11 CPU long tasks with the total of 2.401 s. The total blocking time is 1.590 s and 1 long task before first contentful paint with total time of 311 ms. However the CPU Long Task is depending on the computer/phones actual CPU speed, so you should measure this on the same type of the device that your user is using. Use Geckoprofiler for Firefox or Chromes tracelog to debug your long tasks.
Long CPU tasks locks the thread. To the user this is commonly visible as a "locked up" page where the browser is unable to respond to user input; this is a major source of bad user experience on the web today. However the CPU Long Task is depending on the computer/phones actual CPU speed, so you should measure this on the same type of the device that your user is using. To debug you should use the Chrome timeline log and drag/drop it into devtools or use Firefox Geckoprofiler.
modernImageFormatsThe page ships 63 images (out of 63) in JPEG/PNG/GIF without a modern alternative. Wrap them in a <picture> with a <source type="image/avif"> or "image/webp" before the legacy <img>, or serve modern formats from your image pipeline directly. AVIF and WebP usually deliver 25–50% smaller files at the same quality.
AVIF and WebP routinely deliver 25–50% smaller files than JPEG and PNG at the same perceived quality, and every browser version still under support understands at least one of them. Ship modern formats either through a <picture> element with <source type="image/avif"> / "image/webp" entries in front of the legacy <img>, or directly from a content-negotiating image pipeline that returns AVIF / WebP when the client accepts it. https://web.dev/articles/serve-images-webp
javascriptSizeThe total JavaScript transfer size is 380.8 kB and the uncompressed size is 1.5 MB. This is totally crazy! There is really room for improvement here.
A lot of JavaScript often means you are downloading more than you need. How complex is the page and what can the user do on the page? Do you use multiple JavaScript frameworks?
cacheHeadersThe page has 4 requests that are missing a cache time. Configure a cache time so the browser doesn't need to download them every time. It will save 147.8 kB the next access.
The easiest way to make your page fast is to avoid doing requests to the server. Setting a cache header on your server response will tell the browser that it doesn't need to download the asset again during the configured cache time! Always try to set a cache time if the content doesn't change for every request.
cacheHeadersLongThe page has 23 requests that have a shorter cache time than one year (but still a cache time).
Setting a cache header is good. Setting a long cache header (a year) is even better because the asset will stay in the browser cache across visits. For content-hashed URLs (e.g. app.4af2.css) you can safely use Cache-Control: max-age=31536000, immutable. For unversioned URLs that may change, use a revalidating strategy instead.
avoidScalingImagesThe page has 2 images that are scaled more than 100 pixels. It would be better if those images are sent so the browser don't need to scale them.
It's easy to scale images in the browser and make sure they look good in different devices, however that is bad for performance! Scaling images in the browser takes extra CPU time and will hurt performance on mobile. And the user will download extra kilobytes (sometimes megabytes) of data that could be avoided. Don't do that, make sure you create multiple version of the same image server-side and serve the appropriate one.
privateAssetsThe page has 3 requests with private headers. The main page has a private header. It could be right in some cases where the user can be logged in and served specific content. But if your asset is static it should never be private. Make sure that the assets really should be private and only used by one user. Otherwise, make it cacheable for everyone.
If you set private headers on content, that means that the content are specific for that user. Static content should be able to be cached and used by everyone. Avoid setting the cache header to private.
assetsRedirectsThe page has 1 redirect. 1 of the redirects are from the base domain, please fix them!
A redirect is one extra step for the user to download the asset. Avoid that if you want to be fast. Redirects are even more of a showstopper on mobile.
decodingAsyncThe page has 5 images (out of 67) without a decoding hint. Add decoding="async" to non-critical images so the browser can decode them off the main thread.
Setting decoding="async" on an <img> tells the browser it can decode the image off the main thread, which keeps the page responsive to user interactions while images are being processed. The default ("auto") leaves the choice to the browser. https://developer.mozilla.org/en-US/docs/Web/HTML/Element/img#decoding
inlineCssThe page has both inline CSS and CSS requests even though it uses a HTTP/2-ish connection. If you have many users on slow connections, it can be better to only inline the CSS. Run your own tests and check the waterfall graph to see what happens.
In the early days of the Internet, inlining CSS was one of the ugliest things you can do. That has changed if you want your page to start rendering fast for your user. Always inline the critical CSS when you use HTTP/1 and HTTP/2 (avoid doing CSS requests that block rendering) and lazy load and cache the rest of the CSS. It is a little more complicated when using HTTP/2. Does your server support HTTP push? Then maybe that can help. Do you have a lot of users on a slow connection and are serving large chunks of HTML? Then it could be better to use the inline technique, becasue some servers always prioritize HTML content over CSS so the user needs to download the HTML first, before the CSS is downloaded.
lazyLoadingImagesThe page has 2 below-the-fold images without loading="lazy". Add loading="lazy" so the browser defers downloading and decoding them until the user scrolls them into view.
Adding loading="lazy" to an <img> tells the browser not to download or decode it until it is close to the viewport. For images that the user may never see (deep in the page, behind a tab, in a footer carousel), this saves bandwidth and main-thread time during initial render. The LCP image and any image in the initial viewport should NOT be lazy-loaded — that delays the first paint. https://developer.mozilla.org/en-US/docs/Web/HTML/Element/img#loading
avoidRenderBlockingThe page has 3 blocking requests and 0 in body parser blocking (0 JavaScript and 3 CSS). There are 1 potentially render blocking requests. You need to verify if it is render blocking: https://vi.wikipedia.org/w/load.php?lang=vi&modules=startup&only=scripts&raw=1&skin=minerva
The critical rendering path is what the browser needs to do to start rendering the page. Every file requested inside of the head element will postpone the rendering of the page, because the browser need to do the request. Avoid loading JavaScript synchronously inside of the head (you should not need JavaScript to render the page), request files from the same domain as the main document (to avoid DNS lookups) and inline CSS for really fast rendering and a short rendering path.
imageAltTextThe page has 28 images without an alt attribute. Add alt="..." with a description, or alt="" if the image is purely decorative.
Every <img> needs an alt attribute. Use alt="meaningful description" for content images so assistive technologies can announce them, or alt="" (or role="presentation" / aria-hidden="true") for purely decorative images so they are skipped. A missing alt attribute leaves screen reader users with no information at all. https://developer.mozilla.org/en-US/docs/Web/HTML/Element/img#alt
metaDescriptionThe page is missing a meta description.
Use a page description to make the page more relevant to search engines.
unnecessaryHeadersThere are 26 responses that sets both a max-age and expires header. There are 31 responses that sets a server header.
Do not send headers that you don't need. We look for p3p, cache-control and max-age, pragma, server and x-frame-options headers. Have a look at Andrew Betts - Headers for Hackers talk as a guide https://www.youtube.com/watch?v=k92ZbrY815c or read https://www.fastly.com/blog/headers-we-dont-want.
longHeadershttps://vi.wikipedia.../Vincent_van_Gogh has a header content-security-policy that is 4501 characters long. https://vi.wikipedia...ia.org/w/load.php has a header sourcemap that is 1342 characters long.
Do not send response headers that are too long.
crossOriginEmbedderPolicyHeaderSet a Cross-Origin-Embedder-Policy header (typically require-corp or credentialless) on the document response to control cross-origin embedding.
Cross-Origin-Embedder-Policy (COEP) makes the page refuse to load cross-origin subresources unless they explicitly opt in via CORP or CORS. Together with Cross-Origin-Opener-Policy it puts the page in a cross-origin isolated context, which mitigates cross-window side-channel attacks (Spectre) and unlocks high-resolution timers and SharedArrayBuffer. https://developer.mozilla.org/en-US/docs/Web/HTTP/Headers/Cross-Origin-Embedder-Policy
crossOriginOpenerPolicyHeaderSet a Cross-Origin-Opener-Policy header (typically same-origin) on the document response to isolate the page from cross-origin windows.
Cross-Origin-Opener-Policy (COOP) lets a page sever its window-group ties to cross-origin documents that opened it or that it opens. Together with Cross-Origin-Embedder-Policy it puts the page in a cross-origin isolated context, which mitigates cross-window side-channel attacks (Spectre) and unlocks high-resolution timers and SharedArrayBuffer. https://developer.mozilla.org/en-US/docs/Web/HTTP/Headers/Cross-Origin-Opener-Policy
crossOriginResourcePolicyHeaderSet a Cross-Origin-Resource-Policy header (same-origin, same-site or cross-origin) on the document response to limit who may embed it.
Cross-Origin-Resource-Policy (CORP) is a per-response opt-in that tells the browser which origins are allowed to embed the resource. It blocks cross-origin or cross-site no-cors embedding (img, script, iframe, etc.) and is one of the building blocks of cross-origin isolation. https://developer.mozilla.org/en-US/docs/Web/HTTP/Headers/Cross-Origin-Resource-Policy
permissionsPolicyHeaderSet a Permissions-Policy header to control which browser features the page can use.
The Permissions-Policy response header (the successor to Feature-Policy) lets a site explicitly opt in or out of powerful browser features such as camera, microphone, geolocation, payment and clipboard. Setting a strict policy reduces the attack surface and limits what embedded third parties can do. https://developer.mozilla.org/en-US/docs/Web/HTTP/Headers/Permissions-Policy
referrerPolicyHeaderSet a referrer-policy header to make sure you do not leak user information.
Referrer Policy is a new header that allows a site to control how much information the browser includes with navigations away from a document and should be set by all sites. https://scotthelme.co.uk/a-new-security-header-referrer-policy/.
contentSecurityPolicyHeaderThe policy allows 'unsafe-inline', which lets the browser execute inline scripts and styles directly from the page. Move to nonces or hashes plus 'strict-dynamic' so that inline injection cannot run. The policy allows 'unsafe-eval', which lets the page call eval() and Function(). Almost no application needs this; remove it.
A Content-Security-Policy response header tells the browser which sources of script, style, and other content are allowed. The most effective form is a strict CSP using nonces or hashes together with strict-dynamic; the worst is a missing header, with unsafe-inline and unsafe-eval close behind. https://web.dev/articles/strict-csp
A snapshot of what the browser actually built for this page: the document, how big and deep the DOM tree is and what it kept in storage. Big, deep trees are slower to style and lay out, so the counts Chrome warns about carry a flag.
Document
What the page says it is and how large it rendered.
DOM structure
How much markup the browser has to build, style and lay out.
What the page stored on the client, and the network it was tested on.
Data collected using
Coach-core version 9.2.1. With updated code from
Webappanalyzer 2026-05-04. Use
--browsertime.firefox.includeResponseBodies html or
--browsertime.chrome.includeResponseBodies html to help Wappalyzer find more information about technologies used.
0.0s1.1s1.5s1.7s2.7s2.9s3.5s3.8sWhen the page main content is rendered, collected via the Largest Contentful Paint API. Read more about Largest Contentful Paint.
body > div#mw-mf-viewport > div#mw-mf-page-center > main#content > div#bodyContent > div#mw-content-text > div:eq(0) > section#mwAQ > p#mwDA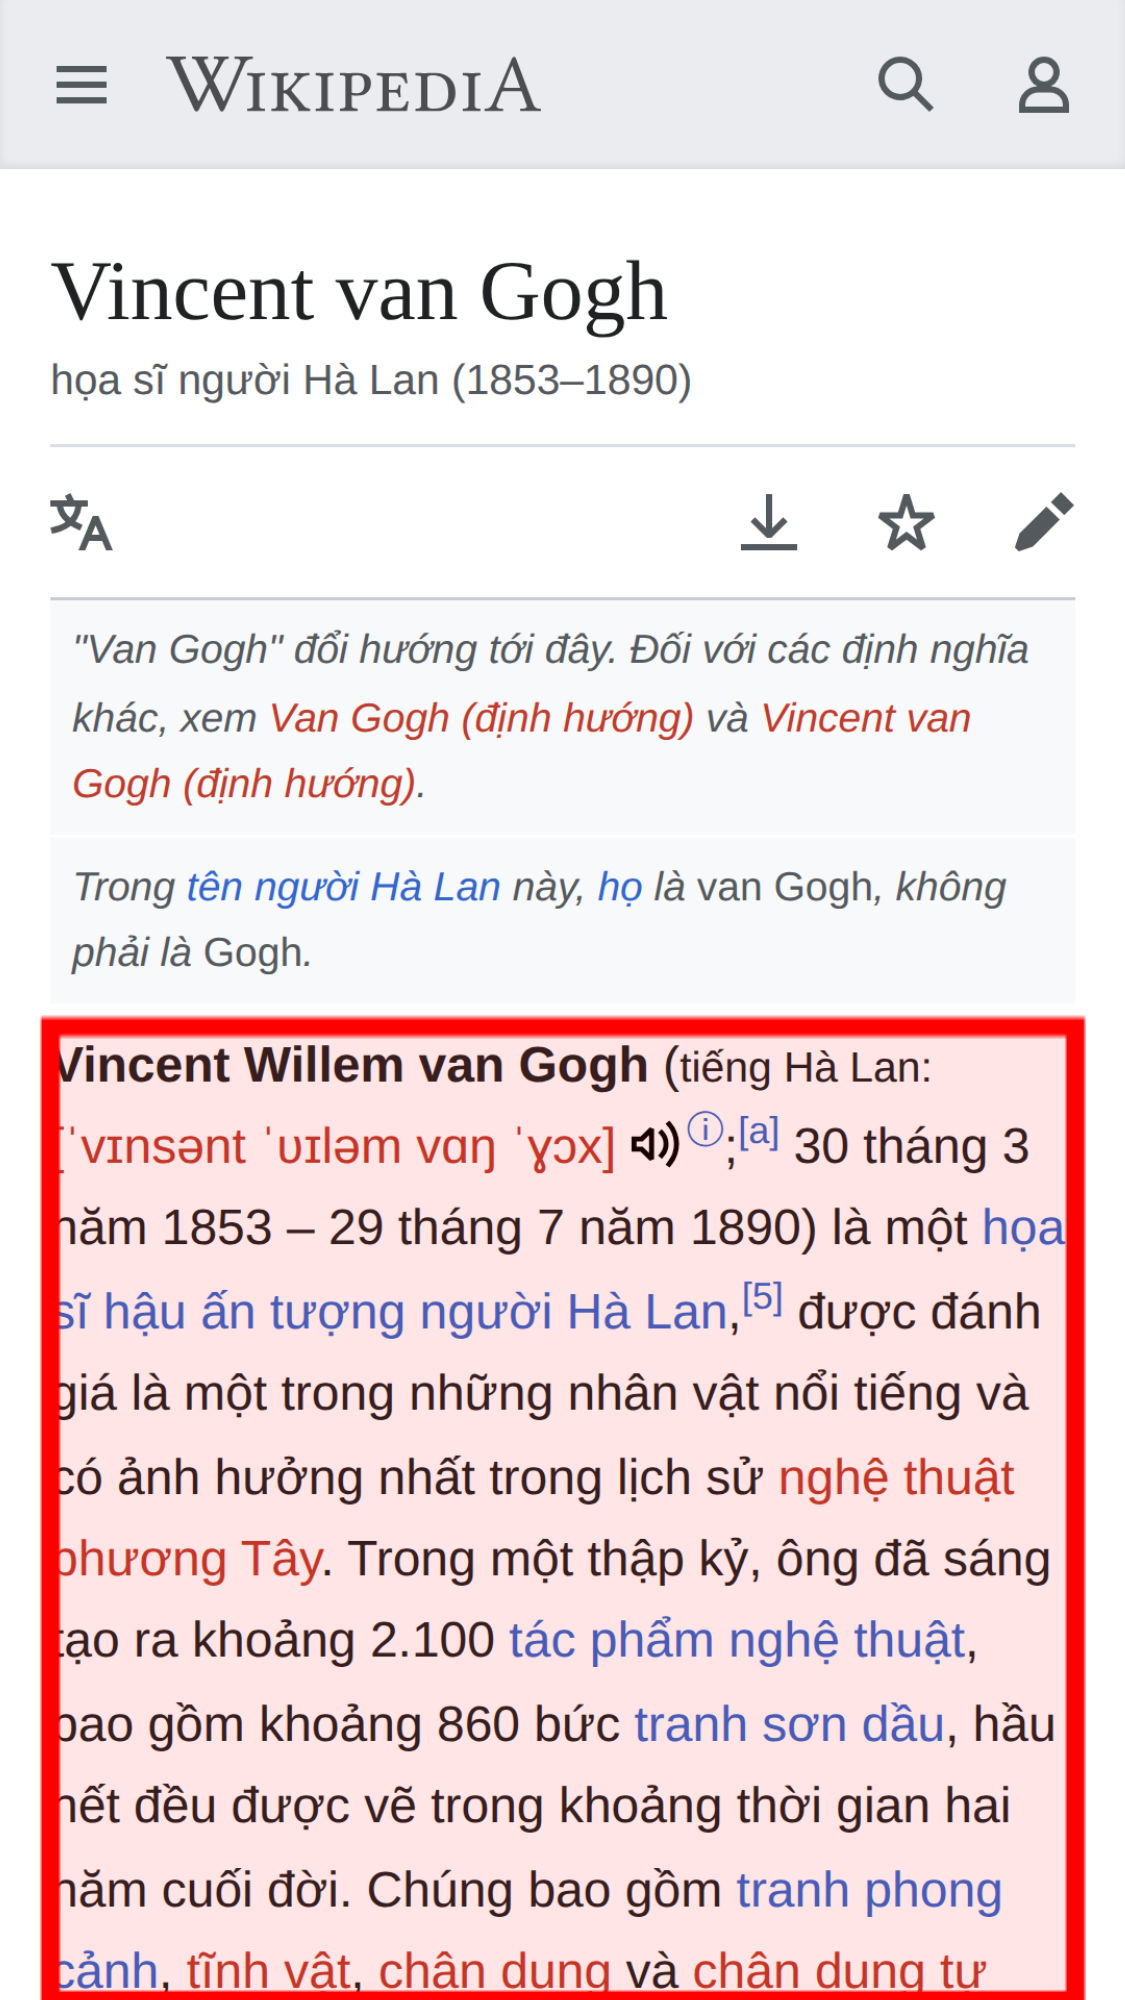
The LCP element is highlighted in the screenshot. If nothing is highlighted the element was removed before the screenshot or the LCP API couldn't find it.
How much the page's content shifts as it loads, collected via the Cumulative Layout Shift API.
No layout shifts were detected on this page.
Timing data the server chose to expose through Server-Timing response headers on the main document — typically backend time, cache status or experiment flags.
| Name | Duration | Description |
|---|---|---|
cache | 0 ms | hit-front |
host | 0 ms | cp3070 |
co_id | 0 ms | 1611043306 |
There are no custom configured scripts.
There are no custom extra metrics from scripting.
How the page is built.
https://vi.wikipedia.org/wiki/Vincent_van_Gogh
| Header | Value |
|---|---|
accept-ch | |
accept-ranges | bytes |
age | 12977 |
cache-control | private, s-maxage=0, max-age=0, must-revalidate, no-transform |
content-encoding | gzip |
content-language | vi |
content-length | 122504 |
content-security-policy | script-src 'unsafe-eval' blob: 'self' meta.wikimedia.org *.wikimedia.org *.wikipedia.org *.wikinews.org *.wiktionary.org *.wikibooks.org *.wikiversity.org *.wikisource.org wikisource.org *.wikiquote.org *.wikidata.org *.wikifunctions.org *.wikivoyage.org *.mediawiki.org mediawiki.org wikimedia.org *.wmflabs.org *.wmcloud.org *.toolforge.org wss://*.toolforge.org *.jsdelivr.net unpkg.com cdnjs.cloudflare.com raw.githubusercontent.com *.github.com code.jquery.com cdn.mathjax.org use.typekit.net fonts.cdnfonts.com use.fontawesome.com i.ytimg.com rsms.me doi.org localhost https://localhost:* http://localhost:* wss://localhost:* ws://localhost:* *.google.com *.gstatic.com *.googleapis.com *.translate.yandex.net yastatic.net ya.ru radically.github.io cdn.sammdot.ca cdn.fontshare.com viaf.org publicai-proxy.alaexis.workers.dev iiif.archive.org api.flickr.com live.staticflickr.com api.anthropic.com api.openai.com api.publicai.co catalogo.pusc.it parsifal.urbe.it opac.sbn.it overpass-api.de api.openrouteservice.org archive.org *.openstreetmap.org *.waymarkedtrails.org *.thunderforest.com registry.ipe.wiki analytics.ipe.wiki qlever.dev app.goacoustic.com wikipedia-archive.ourworldindata.org api.inaturalist.org inaturalist-open-data.s3.amazonaws.com validator.w3.org db.onlinewebfonts.com fontlibrary.org 'unsafe-inline' auth.wikimedia.org; default-src 'self' data: blob: upload.wikimedia.org https://commons.wikimedia.org meta.wikimedia.org *.wikimedia.org *.wikipedia.org *.wikinews.org *.wiktionary.org *.wikibooks.org *.wikiversity.org *.wikisource.org wikisource.org *.wikiquote.org *.wikidata.org *.wikifunctions.org *.wikivoyage.org *.mediawiki.org mediawiki.org wikimedia.org *.wmflabs.org *.wmcloud.org *.toolforge.org wss://*.toolforge.org *.jsdelivr.net unpkg.com cdnjs.cloudflare.com raw.githubusercontent.com *.github.com code.jquery.com cdn.mathjax.org use.typekit.net fonts.cdnfonts.com use.fontawesome.com i.ytimg.com rsms.me doi.org localhost https://localhost:* http://localhost:* wss://localhost:* ws://localhost:* *.google.com *.gstatic.com *.googleapis.com *.translate.yandex.net yastatic.net ya.ru radically.github.io cdn.sammdot.ca cdn.fontshare.com viaf.org publicai-proxy.alaexis.workers.dev iiif.archive.org api.flickr.com live.staticflickr.com api.anthropic.com api.openai.com api.publicai.co catalogo.pusc.it parsifal.urbe.it opac.sbn.it overpass-api.de api.openrouteservice.org archive.org *.openstreetmap.org *.waymarkedtrails.org *.thunderforest.com registry.ipe.wiki analytics.ipe.wiki qlever.dev app.goacoustic.com wikipedia-archive.ourworldindata.org api.inaturalist.org inaturalist-open-data.s3.amazonaws.com validator.w3.org db.onlinewebfonts.com fontlibrary.org en.wikibooks.org en.wikinews.org en.wikiquote.org en.wikisource.org en.wikiversity.org en.wikivoyage.org en.wiktionary.org www.mediawiki.org commons.wikimedia.org foundation.wikimedia.org incubator.wikimedia.org species.wikimedia.org wikimania.wikimedia.org www.wikidata.org www.wikifunctions.org auth.wikimedia.org; style-src 'self' data: blob: upload.wikimedia.org https://commons.wikimedia.org meta.wikimedia.org *.wikimedia.org *.wikipedia.org *.wikinews.org *.wiktionary.org *.wikibooks.org *.wikiversity.org *.wikisource.org wikisource.org *.wikiquote.org *.wikidata.org *.wikifunctions.org *.wikivoyage.org *.mediawiki.org mediawiki.org wikimedia.org *.wmflabs.org *.wmcloud.org *.toolforge.org wss://*.toolforge.org *.jsdelivr.net unpkg.com cdnjs.cloudflare.com raw.githubusercontent.com *.github.com code.jquery.com cdn.mathjax.org use.typekit.net fonts.cdnfonts.com use.fontawesome.com i.ytimg.com rsms.me doi.org localhost https://localhost:* http://localhost:* wss://localhost:* ws://localhost:* *.google.com *.gstatic.com *.googleapis.com *.translate.yandex.net yastatic.net ya.ru radically.github.io cdn.sammdot.ca cdn.fontshare.com viaf.org publicai-proxy.alaexis.workers.dev iiif.archive.org api.flickr.com live.staticflickr.com api.anthropic.com api.openai.com api.publicai.co catalogo.pusc.it parsifal.urbe.it opac.sbn.it overpass-api.de api.openrouteservice.org archive.org *.openstreetmap.org *.waymarkedtrails.org *.thunderforest.com registry.ipe.wiki analytics.ipe.wiki qlever.dev app.goacoustic.com wikipedia-archive.ourworldindata.org api.inaturalist.org inaturalist-open-data.s3.amazonaws.com validator.w3.org db.onlinewebfonts.com fontlibrary.org 'unsafe-inline'; object-src 'none'; report-uri /w/api.php?action=cspreport&format=json; report-to csp-report-to-endpoint |
content-type | text/html; charset=UTF-8 |
date | Mon, 27 Jul 2026 20:37:15 GMT |
last-modified | Sat, 25 Jul 2026 15:02:58 GMT |
nel | { "report_to": "wm_nel", "max_age": 604800, "failure_fraction": 0.05, "success_fraction": 0.0} |
report-to | { "group": "wm_nel", "max_age": 604800, "endpoints": [{ "url": "https://intake-logging.wikimedia.org/v1/events?stream=w3c.reportingapi.network_error&schema_uri=/w3c/reportingapi/network_error/1.0.0" }] } |
reporting-endpoints | csp-report-to-endpoint='/w/api.php?action=cspreport&format=json'; |
server | ATS/9.2.13 |
server-timing | cache;desc="hit-front", host;desc="cp3070",co_id;desc="1611043306" |
strict-transport-security | max-age=106384710; includeSubDomains; preload |
vary | Accept-Encoding,X-Subdomain,Cookie,Authorization,User-Agent |
x-analytics | |
x-cache | cp3070 hit, cp3070 hit/5 |
x-cache-status | hit-front |
x-client-ip | 138.201.135.103 |
x-content-type-options | nosniff |
x-request-id | bf42f666-7469-4eed-ab22-ce989b8e1be0 |
Transfer size692.5 KB
Content size2.5 MB
Requests30
| Content | Header Size | Transfer Size | Content Size | Requests |
|---|---|---|---|---|
| html | 0 b | 125.7 KB | 696.4 KB | 1 |
| css | 0 b | 26.5 KB | 178.1 KB | 3 |
| javascript | 0 b | 371.8 KB | 1.4 MB | 6 |
| image | 0 b | 144.9 KB | 140.4 KB | 3 |
| favicon | 0 b | 1.8 KB | 2.7 KB | 1 |
| svg | 0 b | 19.9 KB | 11.5 KB | 15 |
| json | 0 b | 1.9 KB | 295 B | 1 |
| Total | 0 b | 692.5 KB | 2.5 MB | 30 |
| Domain | Total download time | Transfer Size | Content Size | Requests |
|---|---|---|---|---|
| vi.wikipedia.org | 5.337 s | 548.2 KB | 2.3 MB | 28 |
| upload.wikimedia.org | 1.319 s | 142.9 KB | 139.1 KB | 2 |
| auth.wikimedia.org | 186 ms | 1.5 KB | 254 B | 1 |
| type | min | median | max |
|---|---|---|---|
| Expires | 0 seconds | 4 weeks | 1 year |
| Last modified | 2 days | 3 weeks | 42 weeks |
The page logs the following messages to the console.
| Level | Message |
|---|---|
| WARNING | https://vi.wikipedia.org/w/load.php?lang=vi&modules=startup&only=scripts&raw=1&skin=minerva 11:149 "This page is using the deprecated ResourceLoader module \"jquery.ui\".\nPlease use Codex instead." |
| INFO | https://vi.wikipedia.org/w/load.php?lang=vi&modules=ext.centralNotice.choiceData%2Cdisplay%2CgeoIP%2CimpressionDiet%2CkvStore%2CstartUp%7Cext.centralauth.ForeignApi%2Ccentralautologin%7Cext.checkUser.clientHints%7Cext.cite.ux-enhancements%7Cext.cx.entrypoints.languagesearcher.v2%7Cext.cx.eventlogging.campaigns%7Cext.cx.model%7Cext.echo.centralauth%7Cext.eventLogging%2CnavigationTiming%2Cpopups%2CtestKitchen%2CwikimediaEvents%7Cext.eventLogging.metricsPlatform%7Cext.phonos.init%7Cext.quicksurveys.init%2Clib%7Cext.relatedArticles.readMore.bootstrap%7Cext.scribunto.logs%7Cext.uls.interface%2Cpreferences%2Cwebfonts%7Cext.uls.rewrite.entrypoints%7Cext.urlShortener.toolbar%7Cext.wikimediaEvents.testKitchen%7Cjquery%2Coojs%2Csite%7Cjquery.client%2Cspinner%2CtextSelection%2Cui%7Cjquery.spinner.styles%7Cjquery.uls.data%7Cmediawiki.DateFormatter%2CForeignApi%2CString%2CTitle%2Capi%2Cbase%2Ccldr%2Ccookie%2Cexperiments%2CjqueryMsg%2Clanguage%2Crouter%2Cstorage%2Ctemplate%2Cuser%2Cutil%2CvisibleTimeout%7Cmediawiki.ForeignApi.core%7Cmediawiki.libs.pluralruleparser%7Cmediawiki.page.media%2Cready%7Cmediawiki.page.watch.ajax%7Cmediawiki.template.mustache%7Cmmv.bootstrap%2Ccodex%7Cmobile.codex.styles%7Cmobile.init%2Cstartup%7Cmw.cx.SiteMapper%7Cmw.externalguidance.init%7Cskins.minerva.scripts%7Cwikibase.databox.fromWikidata&skin=minerva&version=1uo0v 1115:14143 "Tìm hiểu thêm về cách chúng tôi xây dựng trang di động @ https://www.mediawiki.org/wiki/Special:MyLanguage/Extension:MobileFrontend" |
Includes requests done after load event end.
| Content | Transfer Size | Requests |
|---|---|---|
| html | 0 b | 0 |
| css | 0 b | 0 |
| javascript | 5.3 KB | 2 |
| image | 2.1 KB | 1 |
| font | 0 b | 0 |
| favicon | 1.8 KB | 1 |
| Total | 9.2 KB | 5 |
Includes requests done after DOM content loaded.
| Content | Transfer Size | Requests |
|---|---|---|
| html | 0 b | 0 |
| css | 0 b | 0 |
| javascript | 5.3 KB | 2 |
| image | 2.1 KB | 1 |
| font | 0 b | 0 |
| favicon | 1.8 KB | 1 |
| svg | 1.2 KB | 1 |
| Total | 10.4 KB | 6 |
Tasks ≥ 50 ms blocking the main thread, collected via the Long Task API.
A long animation frame (LOAF) is a frame that took ≥ 50 ms from input to the next paint. The part beyond the threshold is blocking time, the number that hurts Interaction to Next Paint and Total Blocking Time. Break long tasks up (scheduler.yield(), smaller chunks) or move the work off the main thread. Read more about the Long Animation Frames API.
| Script | Frames | Time running | Blocking (share by run time) | Forced style & layout | Triggered by |
|---|---|---|---|---|---|
| load.php[startup] | 4 | 968.7 ms | 785.3 ms | 77 ms | timer or animation callback |
| load.php[scripts:ext.centralNotice.choiceData] | 4 | 648.7 ms | 512.5 ms | 6.3 ms | timer or animation callback |
| Vincent_van_Gogh | 1 | 9.5 ms | 4 ms | – | script tag |
A frame's blocking time is split between its scripts by their share of the frame's work, capped at each script's own run time — blocking from work no script owns (HTML parsing, browser internals) stays unattributed. The per-script blocking view below uses the same attribution.
The browser did not report which script was responsible for this frame — typically its own style/layout work, or a cross-origin script it will not name.
The browser did not report which script was responsible for this frame — typically its own style/layout work, or a cross-origin script it will not name.
1 more long frame carried no blocking time (nothing ran past the 50 ms threshold) — long, but harmless to INP and TBT.
How much each script blocked the main thread, derived from the Long Animation Frame API. Each frame's blocking time is split between its scripts by their share of the frame's work, capped at each script's own run time — blocking from work no script owns (HTML parsing, browser internals) is not attributed (older data credits the script that started the frame). The closest answer to "which script should I fix to improve TBT" the platform exposes.
Total Blocking Time attributed per script from the Chrome trace: every main-thread task longer than 50 ms blocks input for the remainder, and each blocking task is credited to the script whose own code ran the longest during that task.
All main-thread work during the full page load, not just the share that blocked input. Calculated from the Chrome trace.
parseHTMLstyleLayoutscriptParseCompilescriptEvaluationpaintCompositeRendergarbageCollectionotherThe functions where main-thread JavaScript time was actually spent, sampled by Chrome's JavaScript profiler. Self time is spent in the function itself; total time includes the functions it called. For loader/dispatcher functions whose total dwarfs their self time, the runs line shows the top functions and modules (up to five, ≥ 1 ms) the total was actually spent running.
| Function | Where | Self time | Total time |
|---|---|---|---|
querySelectorAll | 133.6 ms | 133.6 ms | |
flushWritesruns: load.php[startup] (23.0 ms) | load.php[startup] | 133.5 ms | 156.6 ms |
runScriptruns: load.php[scripts:ext.centralNotice.choiceData] (407.6 ms), load.php[scripts:ext.gadget.AVIM] (33.6 ms) | load.php[startup] | 64.5 ms | 714.5 ms |
buildFragmentruns: load.php[scripts:ext.centralNotice.choiceData] (5.9 ms), appendChild (1.2 ms) | load.php[scripts:ext.centralNotice.choiceData] | 61.3 ms | 69.8 ms |
insertBefore | 55.0 ms | 55.0 ms | |
setAttribute | 50.6 ms | 50.6 ms | |
computeStyleTestsruns: removeChild (3.3 ms) | load.php[scripts:ext.centralNotice.choiceData] | 47.5 ms | 50.8 ms |
(anonymous) | load.php[scripts:ext.centralNotice.choiceData] | 45.5 ms | 45.5 ms |
requireruns: load.php[scripts:ext.centralNotice.choiceData] (21.8 ms) | load.php[startup] | 43.3 ms | 76.0 ms |
setTimeout | 34.1 ms | 34.1 ms | |
implruns: load.php[startup] (3.1 ms), load.php[scripts:ext.centralNotice.choiceData] (2.5 ms) | load.php[startup] | 30.4 ms | 36.8 ms |
findruns: querySelectorAll (131.0 ms), load.php[scripts:ext.centralNotice.choiceData] (13.8 ms), getElementsByTagName (4.9 ms) | load.php[scripts:ext.centralNotice.choiceData] | 29.2 ms | 179.0 ms |
truns: load.php[scripts:ext.centralNotice.choiceData] (200.4 ms) | load.php[scripts:ext.centralNotice.choiceData] | 28.4 ms | 189.9 ms |
doPropagationruns: load.php[startup] (289.6 ms), load.php[scripts:ext.centralNotice.choiceData] (3.0 ms) | load.php[startup] | 26.0 ms | 318.6 ms |
(anonymous)runs: after (12.0 ms), createElement (1.1 ms) | load.php[scripts:ext.centralNotice.choiceData] | 24.7 ms | 38.6 ms |
How much setTimeout/setInterval work the page runs, credited to the script that scheduled each timer. Many zero-delay timers mean work sliced into a machine-gun of tiny tasks; repeating timers are polling.
| Set by | Delay | Type | Times set | Times fired | Fire time |
|---|---|---|---|---|---|
| load.php[scripts:ext.centralNotice.choiceData]:393 | 0 ms | once | 58 | 58 | 720.5 ms |
| load.php[scripts:ext.centralNotice.choiceData]:395 | 0 ms | once | 1 | 1 | 5.8 ms |
SafeStorage in load.php[scripts:ext.centralNotice.choiceData]:1011 | 2000 ms | once | 2 | 2 | 4.2 ms |
| load.php[scripts:ext.centralNotice.choiceData]:127 | 0 ms | once | 1 | 1 | 2.3 ms |
requestUpdate in load.php[startup]:22 | 2000 ms | once | 1 | 1 | 0.1 ms |
run in load.php[scripts:ext.centralNotice.choiceData]:186 | 60000 ms | once | 1 | 0 | 0.0 ms |
setActive in load.php[scripts:ext.centralNotice.choiceData]:186 | 100000 ms | once | 1 | 0 | 0.0 ms |
A forced reflow happens when JavaScript reads a layout-triggering property (offsetTop, getBoundingClientRect, …) inside a handler, forcing the browser to synchronously recompute layout. The scripts below caused most of the page's reflows. Fix them in priority order.
Each long animation frame reports how much time each script spent forcing synchronous style and layout, i.e. JavaScript reading layout-triggering properties mid-execution. Same actionable answer as forced reflows above but measured directly by the browser instead of inferred from the trace.
Main-thread CPU time from the Chrome trace split by domain. First party is wikipedia.org.
Animations that fell back from the compositor to the main thread, blocking each frame instead of running on the GPU.
The reason decides the action: “animation has no visible change” means Chrome skipped compositing because nothing visible moves — harmless. Property-related reasons mean the keyframes animate something other than transform or opacity.
Want to dig deeper? Download the Chrome trace and drag-and-drop it into Performance in DevTools.