Tested 2026-06-24 00:11:41 using Chrome 149.0.7827.53 (script).(runtime settings)
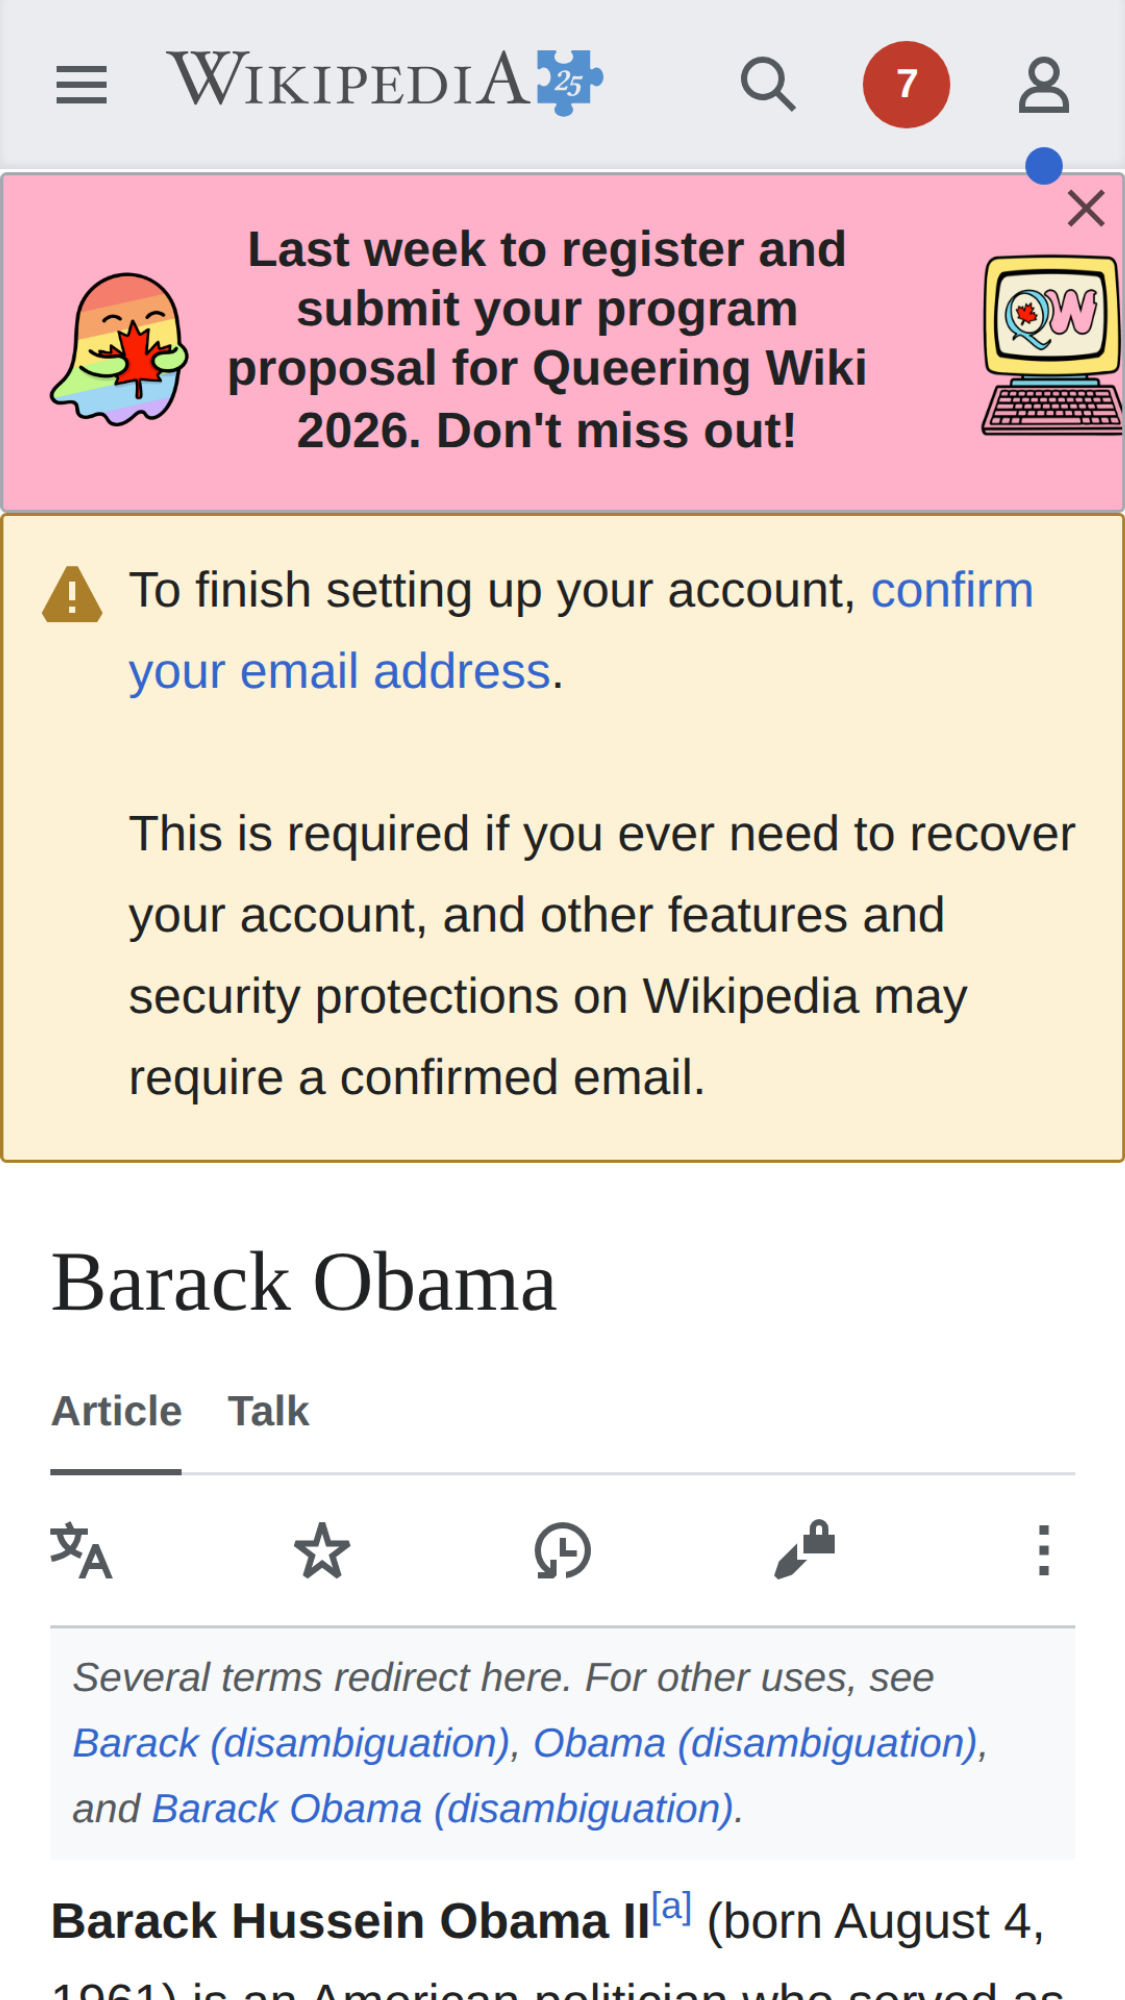
Test mobile as a logged in userLogin the user with an empty browser cache, then visit Obama and Facebook
| Metric | min | median | mean | max |
|---|---|---|---|---|
| Visual Metrics | ||||
| FirstVisualChange | 5.300 s | 5.300 s | 5.300 s | 5.300 s |
| LastVisualChange | 21.966 s | 21.966 s | 21.966 s | 21.966 s |
| SpeedIndex | 7.581 s | 7.581 s | 7.581 s | 7.581 s |
| LargestImage | 8.100 s | 8.100 s | 8.100 s | 8.100 s |
| Heading | 8.100 s | 8.100 s | 8.100 s | 8.100 s |
| LargestContentfulPaint | 8.100 s | 8.100 s | 8.100 s | 8.100 s |
| LastMeaningfulPaint | 8.100 s | 8.100 s | 8.100 s | 8.100 s |
| VisualReadiness | 16.666 s | 16.666 s | 16.666 s | 16.666 s |
| VisualComplete85 | 8.100 s | 8.100 s | 8.100 s | 8.100 s |
| VisualComplete95 | 21.966 s | 21.966 s | 21.966 s | 21.966 s |
| VisualComplete99 | 21.966 s | 21.966 s | 21.966 s | 21.966 s |
| Google Web Vitals | ||||
| Time To First Byte (TTFB) | 4.020 s | 4.020 s | 4.020 s | 4.020 s |
| Largest Contentful Paint (LCP) | 5.268 s | 5.268 s | 5.268 s | 5.268 s |
| Cumulative Layout Shift (CLS) | 0.1507 | 0.1507 | 0.1507 | 0.1507 |
| More metrics | ||||
| firstPaint | 5.268 s | 5.268 s | 5.268 s | 5.268 s |
| loadEventEnd | 6.238 s | 6.238 s | 6.238 s | 6.238 s |
| User Timing | ||||
| mwStartup | 4.340 s | 4.340 s | 4.340 s | 4.340 s |
| mwCentralNoticeBanner | 7.801 s | 7.801 s | 7.801 s | 7.801 s |
| CPU | ||||
| Total Blocking Time | 1.309 s | 1.309 s | 1.309 s | 1.309 s |
| Max Potential FID | 375 ms | 375 ms | 375 ms | 375 ms |
| CPU long tasks | 17 | 17 | 17 | 17 |
| CPU last long task happens at | 8.389 s | 8.389 s | 8.389 s | 8.389 s |
Run 1 SpeedIndex median
Use --filmstrip.showAll to show all filmstrips.
 0 s4.4 sCPU Long Task duration 93 msmwStartup 4.340 s4.9 sCPU Long Task duration 345 ms
 5.3 sFirst Contentful Paint 5.268 sLCP <DIV> 5.268 sFirst Visual Change 5.300 s
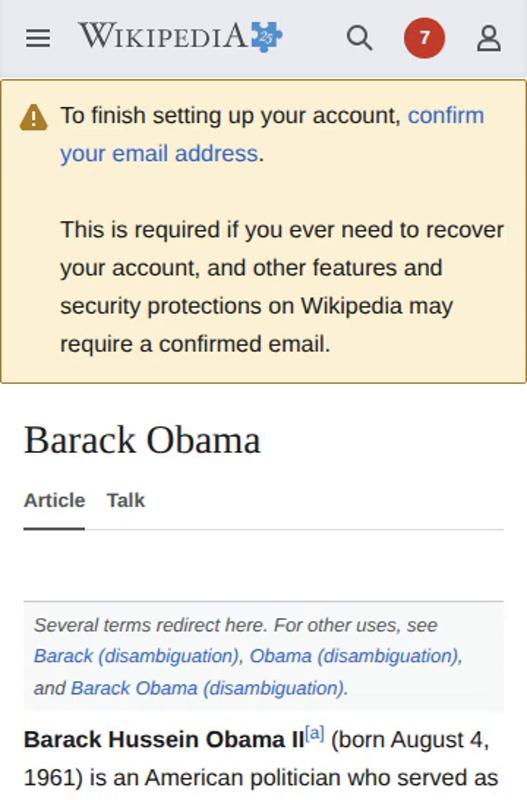 5.4 s
5.4 s 5.5 sCPU Long Task duration 222 ms
 5.6 s
5.6 s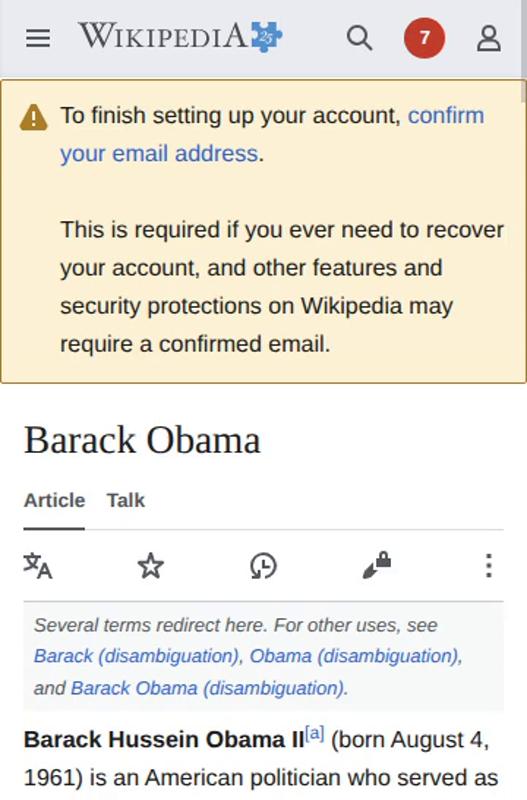 5.7 s
5.7 s 5.8 sCPU Long Task duration 54 ms
 5.9 s
5.9 s 6 s
6 s 6.1 sCPU Long Task duration 52 msDOM Content Loaded Time 6.070 s
 6.2 sCPU Long Task duration 85 ms
 6.3 sPage Load Time 6.238 s
 6.4 sCPU Long Task duration 50 ms
 6.5 sCPU Long Task duration 152 ms
 6.6 sCPU Long Task duration 111 ms
 6.7 s
6.7 s 6.8 sCPU Long Task duration 375 ms
 6.9 s
6.9 s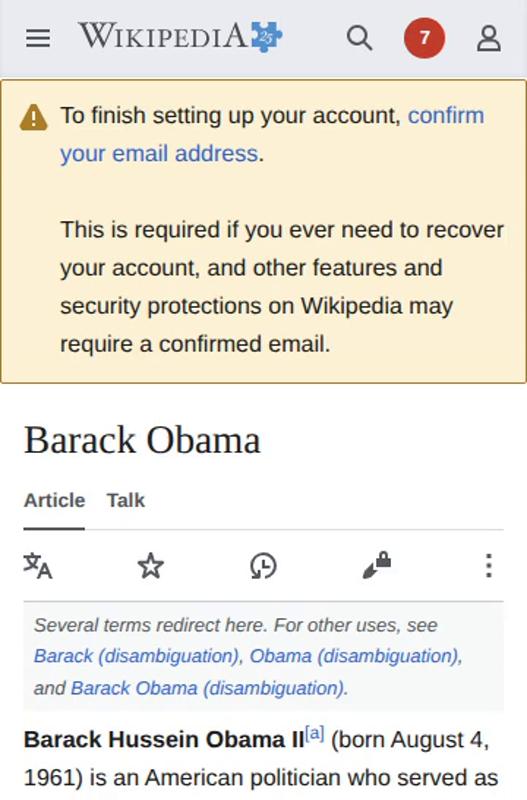 7 s
7 s 7.1 s
7.1 s 7.2 s
7.2 s 7.3 sCPU Long Task duration 81 ms
 7.4 sCPU Long Task duration 155 ms
 7.5 s7.6 sCPU Long Task duration 241 ms7.9 smwCentralNoticeBanner 7.801 sCPU Long Task duration 186 ms
 8.1 sLayout Shift 0.15067 8.028 sVisual Complete 85% 8.100 sLargest Image 8.100 sHeading 8.100 s
 8.2 sCPU Long Task duration 59 msCPU Long Task duration 66 ms
 8.3 s
8.3 s 8.4 sCPU Long Task duration 170 ms
 8.5 s
8.5 s 8.6 s
8.6 s 8.7 s
8.7 s 8.8 s
8.8 s 8.9 s
8.9 s 9 s
9 s 9.1 s
9.1 s 9.2 s
9.2 s 9.3 s
9.3 s 9.4 s
9.4 s 9.5 s
9.5 s 9.6 s
9.6 s 9.7 s
9.7 s 9.8 s
9.8 s 9.9 s
9.9 s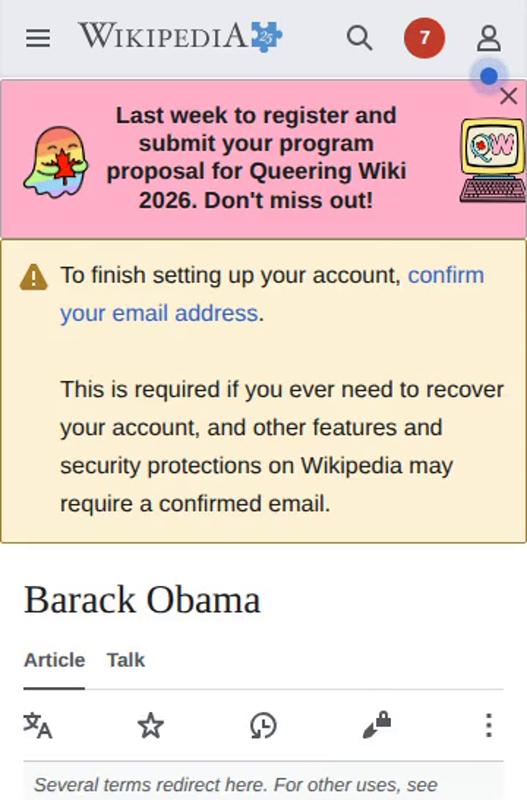 10 s
10 s 10.1 s
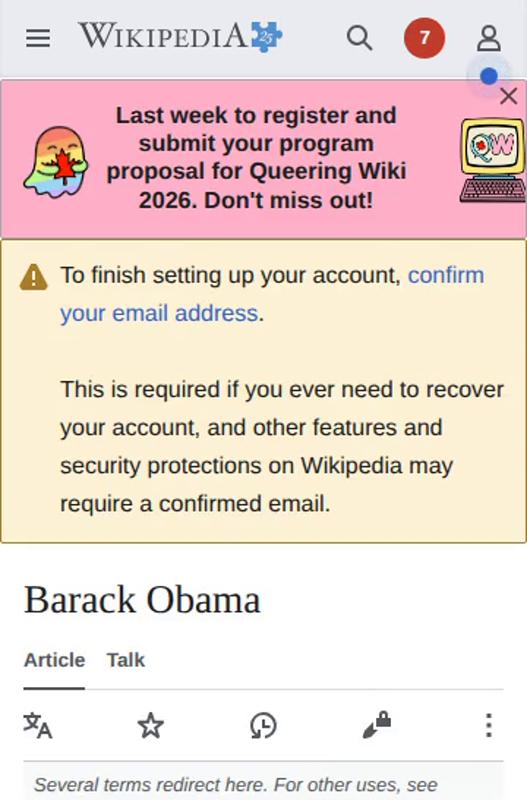 10.2 s
 10.3 s
 10.5 s
 10.6 s
 10.7 s
 10.8 s
 10.9 s
 11 s
11 s 11.1 s
 11.2 s
 11.3 s
 11.4 s
 11.5 s
 11.6 s
 11.7 s
 11.8 sFully Loaded 11.726 s
 11.9 s
 12 s
12 s 12.1 s
 12.2 s
 12.3 s
 12.4 s
 12.5 s
 12.6 s
 12.7 s
 12.8 s
 12.9 s
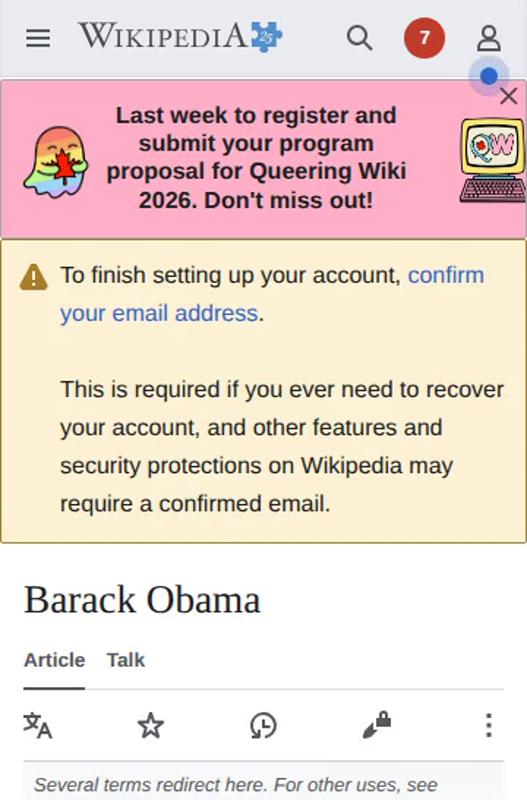 13 s
13 s 13.1 s
 13.2 s
 13.3 s
 13.4 s
 13.5 s
 13.6 s
 13.7 s
 13.8 s
 13.9 s
 14 s
14 s 14.1 s
 14.2 s
 14.3 s
 14.4 s
 14.5 s
 14.6 s
 14.7 s
 14.8 s
 14.9 s
 15.4 s
 15.5 s
 15.6 s
 15.7 s
 15.8 s
 15.9 s
 16 s
16 s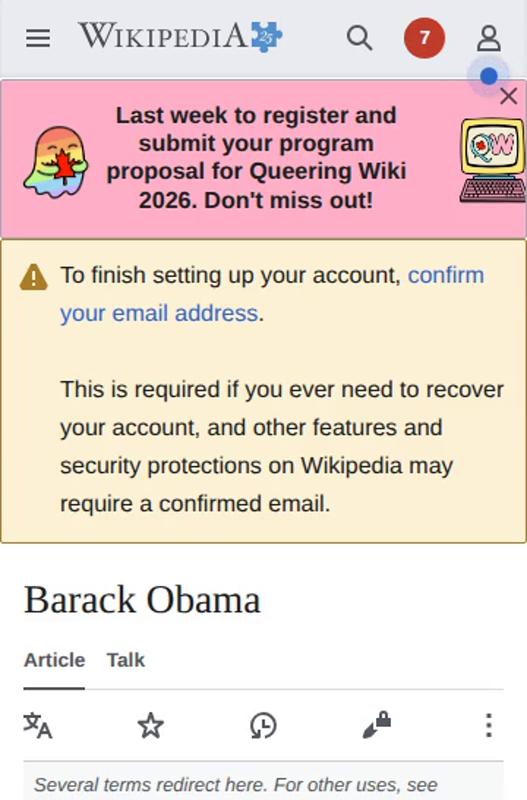 16.1 s
 16.2 s
 16.3 s
 16.4 s
 16.5 s
 16.6 s
 16.7 s
 16.8 s
 16.9 s
 17 s
17 s 17.1 s
 17.2 s
 17.3 s
 17.4 s
 17.5 s
 18.4 s
 18.5 s
 18.6 s
 18.7 s
 18.8 s
 18.9 s
 19 s
19 s 19.1 s
 19.2 s
 19.3 s
 19.4 s
 19.5 s
 19.6 s
 19.7 s
 19.8 s
 19.9 s
 20 s
20 s 20.1 s
 20.2 s
 20.3 s
 20.4 s
 20.5 s
 21.4 s
 21.5 s
 21.6 s
 21.7 s
 21.8 s
 21.9 s
 22 sLast Visual Change 21.966 sVisual Complete 95% 21.966 sVisual Complete 99% 21.966 s
The coach helps you find performance problems on your web page using web performance best practice rules. And gives you advice on privacy and best practices. Tested using Coach-core version 9.2.1.
firstContentfulPaintFirst contentful paint is poor (5.268 s). It is in the Google Web Vitals poor range, slower than 3 seconds.The page has a high time to first byte (TTFB) 4.020 s that you should look into to improve first contentful paint.
The First Contentful Paint (FCP) metric measures the time from when the page starts loading to when any part of the page content is rendered on the screen. For this metric, "content" refers to text, images (including background images), <svg> elements, or non-white <canvas> elements.
largestContentfulPaintLargest contentful paint is poor 5.268 s. It is in the Google Web Vitals poor range, slower than 4 seconds.
Largest contentful paint is one of Google Web Vitals and reports the render time of the largest image or text block visible within the viewport, relative to when the page first started loading. To be fast according to Google, it needs to render before 2.5 seconds and results over 4 seconds is poor performance.
longTasksThe page has 18 CPU long tasks with the total of 2.824 s. The total blocking time is 1.586 s and 2 long tasks before first contentful paint with total time of 438 ms. However the CPU Long Task is depending on the computer/phones actual CPU speed, so you should measure this on the same type of the device that your user is using. Use Geckoprofiler for Firefox or Chromes tracelog to debug your long tasks.
Long CPU tasks locks the thread. To the user this is commonly visible as a "locked up" page where the browser is unable to respond to user input; this is a major source of bad user experience on the web today. However the CPU Long Task is depending on the computer/phones actual CPU speed, so you should measure this on the same type of the device that your user is using. To debug you should use the Chrome timeline log and drag/drop it into devtools or use Firefox Geckoprofiler.
modernImageFormatsThe page ships 44 images (out of 44) in JPEG/PNG/GIF without a modern alternative. Wrap them in a <picture> with a <source type="image/avif"> or "image/webp" before the legacy <img>, or serve modern formats from your image pipeline directly. AVIF and WebP usually deliver 25–50% smaller files at the same quality.
AVIF and WebP routinely deliver 25–50% smaller files than JPEG and PNG at the same perceived quality, and every browser version still under support understands at least one of them. Ship modern formats either through a <picture> element with <source type="image/avif"> / "image/webp" entries in front of the legacy <img>, or directly from a content-negotiating image pipeline that returns AVIF / WebP when the client accepts it. https://web.dev/articles/serve-images-webp
cacheHeadersThe page has 5 requests that are missing a cache time. Configure a cache time so the browser doesn't need to download them every time. It will save 225.1 kB the next access.
The easiest way to make your page fast is to avoid doing requests to the server. Setting a cache header on your server response will tell the browser that it doesn't need to download the asset again during the configured cache time! Always try to set a cache time if the content doesn't change for every request.
avoidScalingImagesThe page has 4 images that are scaled more than 100 pixels. It would be better if those images are sent so the browser don't need to scale them.
It's easy to scale images in the browser and make sure they look good in different devices, however that is bad for performance! Scaling images in the browser takes extra CPU time and will hurt performance on mobile. And the user will download extra kilobytes (sometimes megabytes) of data that could be avoided. Don't do that, make sure you create multiple version of the same image server-side and serve the appropriate one.
cacheHeadersLongThe page has 14 requests that have a shorter cache time than one year (but still a cache time).
Setting a cache header is good. Setting a long cache header (a year) is even better because the asset will stay in the browser cache across visits. For content-hashed URLs (e.g. app.4af2.css) you can safely use Cache-Control: max-age=31536000, immutable. For unversioned URLs that may change, use a revalidating strategy instead.
decodingAsyncThe page has 6 images (out of 48) without a decoding hint. Add decoding="async" to non-critical images so the browser can decode them off the main thread.
Setting decoding="async" on an <img> tells the browser it can decode the image off the main thread, which keeps the page responsive to user interactions while images are being processed. The default ("auto") leaves the choice to the browser. https://developer.mozilla.org/en-US/docs/Web/HTML/Element/img#decoding
optimalCssSizehttps://en.wikipedia.org/w/load.php?lang=en&modules=ext.cite.parsoid.styles%7Cext.cite.styles%7Cext.echo.styles.alert%2Cbadge%7Cext.personalDashboard.menuIcon%7Cext.phonos.icons%2Cstyles%7Cext.relatedArticles.styles%7Cext.tmh.player.styles%7Cext.wikimediaBadges%7Cext.wikimediamessages.styles%7Cmediawiki.codex.messagebox.styles%7Cmediawiki.hlist%7Cmediawiki.skinning.content.parsoid%7Cmediawiki.skins.legacy%7Cmobile.init.styles%7Coojs-ui.styles.icons-alerts%7Cskins.minerva.amc.styles%7Cskins.minerva.codex.styles%7Cskins.minerva.content.styles.images%7Cskins.minerva.icons%2Cstyles%7Cskins.minerva.loggedin.styles%7Cskins.minerva.overflow.icons%7Cskins.minerva.personalMenu.icons%7Cwikibase.client.init&only=styles&skin=minerva size is 30.9 kB (30922) and that is bigger than the limit of 25 kB. Try to keep each CSS response under 25 kB.
Render-blocking CSS holds up the first paint until it has fully downloaded, parsed and applied, so smaller CSS files mean a faster start. Split your CSS into a small critical bundle inlined or eagerly loaded, with the rest lazy-loaded.
| URL | Transfer | Content |
|---|---|---|
| https://en.wikipedia.org/w/load.php...ia.org/w/load.php | 30.2 KB | 244.3 KB |
privateAssetsThe page has 2 requests with private headers. The main page has a private header. It could be right in some cases where the user can be logged in and served specific content. But if your asset is static it should never be private. Make sure that the assets really should be private and only used by one user. Otherwise, make it cacheable for everyone.
If you set private headers on content, that means that the content are specific for that user. Static content should be able to be cached and used by everyone. Avoid setting the cache header to private.
inlineCssThe page has both inline CSS and CSS requests even though it uses a HTTP/2-ish connection. If you have many users on slow connections, it can be better to only inline the CSS. Run your own tests and check the waterfall graph to see what happens.
In the early days of the Internet, inlining CSS was one of the ugliest things you can do. That has changed if you want your page to start rendering fast for your user. Always inline the critical CSS when you use HTTP/1 and HTTP/2 (avoid doing CSS requests that block rendering) and lazy load and cache the rest of the CSS. It is a little more complicated when using HTTP/2. Does your server support HTTP push? Then maybe that can help. Do you have a lot of users on a slow connection and are serving large chunks of HTML? Then it could be better to use the inline technique, becasue some servers always prioritize HTML content over CSS so the user needs to download the HTML first, before the CSS is downloaded.
lazyLoadingImagesThe page has 2 below-the-fold images without loading="lazy". Add loading="lazy" so the browser defers downloading and decoding them until the user scrolls them into view.
Adding loading="lazy" to an <img> tells the browser not to download or decode it until it is close to the viewport. For images that the user may never see (deep in the page, behind a tab, in a footer carousel), this saves bandwidth and main-thread time during initial render. The LCP image and any image in the initial viewport should NOT be lazy-loaded — that delays the first paint. https://developer.mozilla.org/en-US/docs/Web/HTML/Element/img#loading
metaDescriptionThe page is missing a meta description.
Use a page description to make the page more relevant to search engines.
cumulativeLayoutShiftYou have a cumulative layout shift score (0.1507) that needs improvements. It is in the Google Web Vitals needs improvement range, shift higher than 0.1. You should manually check the filmstrip or video and check if it will affect the user.
Cumulative Layout Shift measures the sum total of all individual layout shift scores for unexpected layout shift that occur. The metric is measuring visual stability by quantify how often users experience unexpected layout shifts. It is one of Google Web Vitals.
unnecessaryHeadersThere are 15 responses that sets both a max-age and expires header. There are 21 responses that sets a server header.
Do not send headers that you don't need. We look for p3p, cache-control and max-age, pragma, server and x-frame-options headers. Have a look at Andrew Betts - Headers for Hackers talk as a guide https://www.youtube.com/watch?v=k92ZbrY815c or read https://www.fastly.com/blog/headers-we-dont-want.
imageAltTextThe page has 3 images without an alt attribute. Add alt="..." with a description, or alt="" if the image is purely decorative.
Every <img> needs an alt attribute. Use alt="meaningful description" for content images so assistive technologies can announce them, or alt="" (or role="presentation" / aria-hidden="true") for purely decorative images so they are skipped. A missing alt attribute leaves screen reader users with no information at all. https://developer.mozilla.org/en-US/docs/Web/HTML/Element/img#alt
longHeadershttps://en.wikipedia...wiki/Barack_Obama has a header content-security-policy that is 4166 characters long.
Do not send response headers that are too long.
crossOriginEmbedderPolicyHeaderSet a Cross-Origin-Embedder-Policy header (typically require-corp or credentialless) on the document response to control cross-origin embedding.
Cross-Origin-Embedder-Policy (COEP) makes the page refuse to load cross-origin subresources unless they explicitly opt in via CORP or CORS. Together with Cross-Origin-Opener-Policy it puts the page in a cross-origin isolated context, which mitigates cross-window side-channel attacks (Spectre) and unlocks high-resolution timers and SharedArrayBuffer. https://developer.mozilla.org/en-US/docs/Web/HTTP/Headers/Cross-Origin-Embedder-Policy
crossOriginOpenerPolicyHeaderSet a Cross-Origin-Opener-Policy header (typically same-origin) on the document response to isolate the page from cross-origin windows.
Cross-Origin-Opener-Policy (COOP) lets a page sever its window-group ties to cross-origin documents that opened it or that it opens. Together with Cross-Origin-Embedder-Policy it puts the page in a cross-origin isolated context, which mitigates cross-window side-channel attacks (Spectre) and unlocks high-resolution timers and SharedArrayBuffer. https://developer.mozilla.org/en-US/docs/Web/HTTP/Headers/Cross-Origin-Opener-Policy
crossOriginResourcePolicyHeaderSet a Cross-Origin-Resource-Policy header (same-origin, same-site or cross-origin) on the document response to limit who may embed it.
Cross-Origin-Resource-Policy (CORP) is a per-response opt-in that tells the browser which origins are allowed to embed the resource. It blocks cross-origin or cross-site no-cors embedding (img, script, iframe, etc.) and is one of the building blocks of cross-origin isolation. https://developer.mozilla.org/en-US/docs/Web/HTTP/Headers/Cross-Origin-Resource-Policy
permissionsPolicyHeaderSet a Permissions-Policy header to control which browser features the page can use.
The Permissions-Policy response header (the successor to Feature-Policy) lets a site explicitly opt in or out of powerful browser features such as camera, microphone, geolocation, payment and clipboard. Setting a strict policy reduces the attack surface and limits what embedded third parties can do. https://developer.mozilla.org/en-US/docs/Web/HTTP/Headers/Permissions-Policy
referrerPolicyHeaderSet a referrer-policy header to make sure you do not leak user information.
Referrer Policy is a new header that allows a site to control how much information the browser includes with navigations away from a document and should be set by all sites. https://scotthelme.co.uk/a-new-security-header-referrer-policy/.
contentSecurityPolicyHeaderThe policy allows 'unsafe-inline', which lets the browser execute inline scripts and styles directly from the page. Move to nonces or hashes plus 'strict-dynamic' so that inline injection cannot run. The policy allows 'unsafe-eval', which lets the page call eval() and Function(). Almost no application needs this; remove it.
A Content-Security-Policy response header tells the browser which sources of script, style, and other content are allowed. The most effective form is a strict CSP using nonces or hashes together with strict-dynamic; the worst is a missing header, with unsafe-inline and unsafe-eval close behind. https://web.dev/articles/strict-csp
Data collected using
Coach-core version 9.2.1. With updated code from
Webappanalyzer 2026-05-04. Use
--browsertime.firefox.includeResponseBodies html or
--browsertime.chrome.includeResponseBodies html to help Wappalyzer find more information about technologies used.
Data from run 1
0.0s7.1s9.5s11.7s13.7s16.2s19.1s22.0sWhen the page main content is rendered, collected via the Largest Contentful Paint API. Read more about Largest Contentful Paint.
body > div#mw-mf-viewport > div#mw-mf-page-center > main#content > div:eq(0) > div#siteNotice > div:eq(1) > div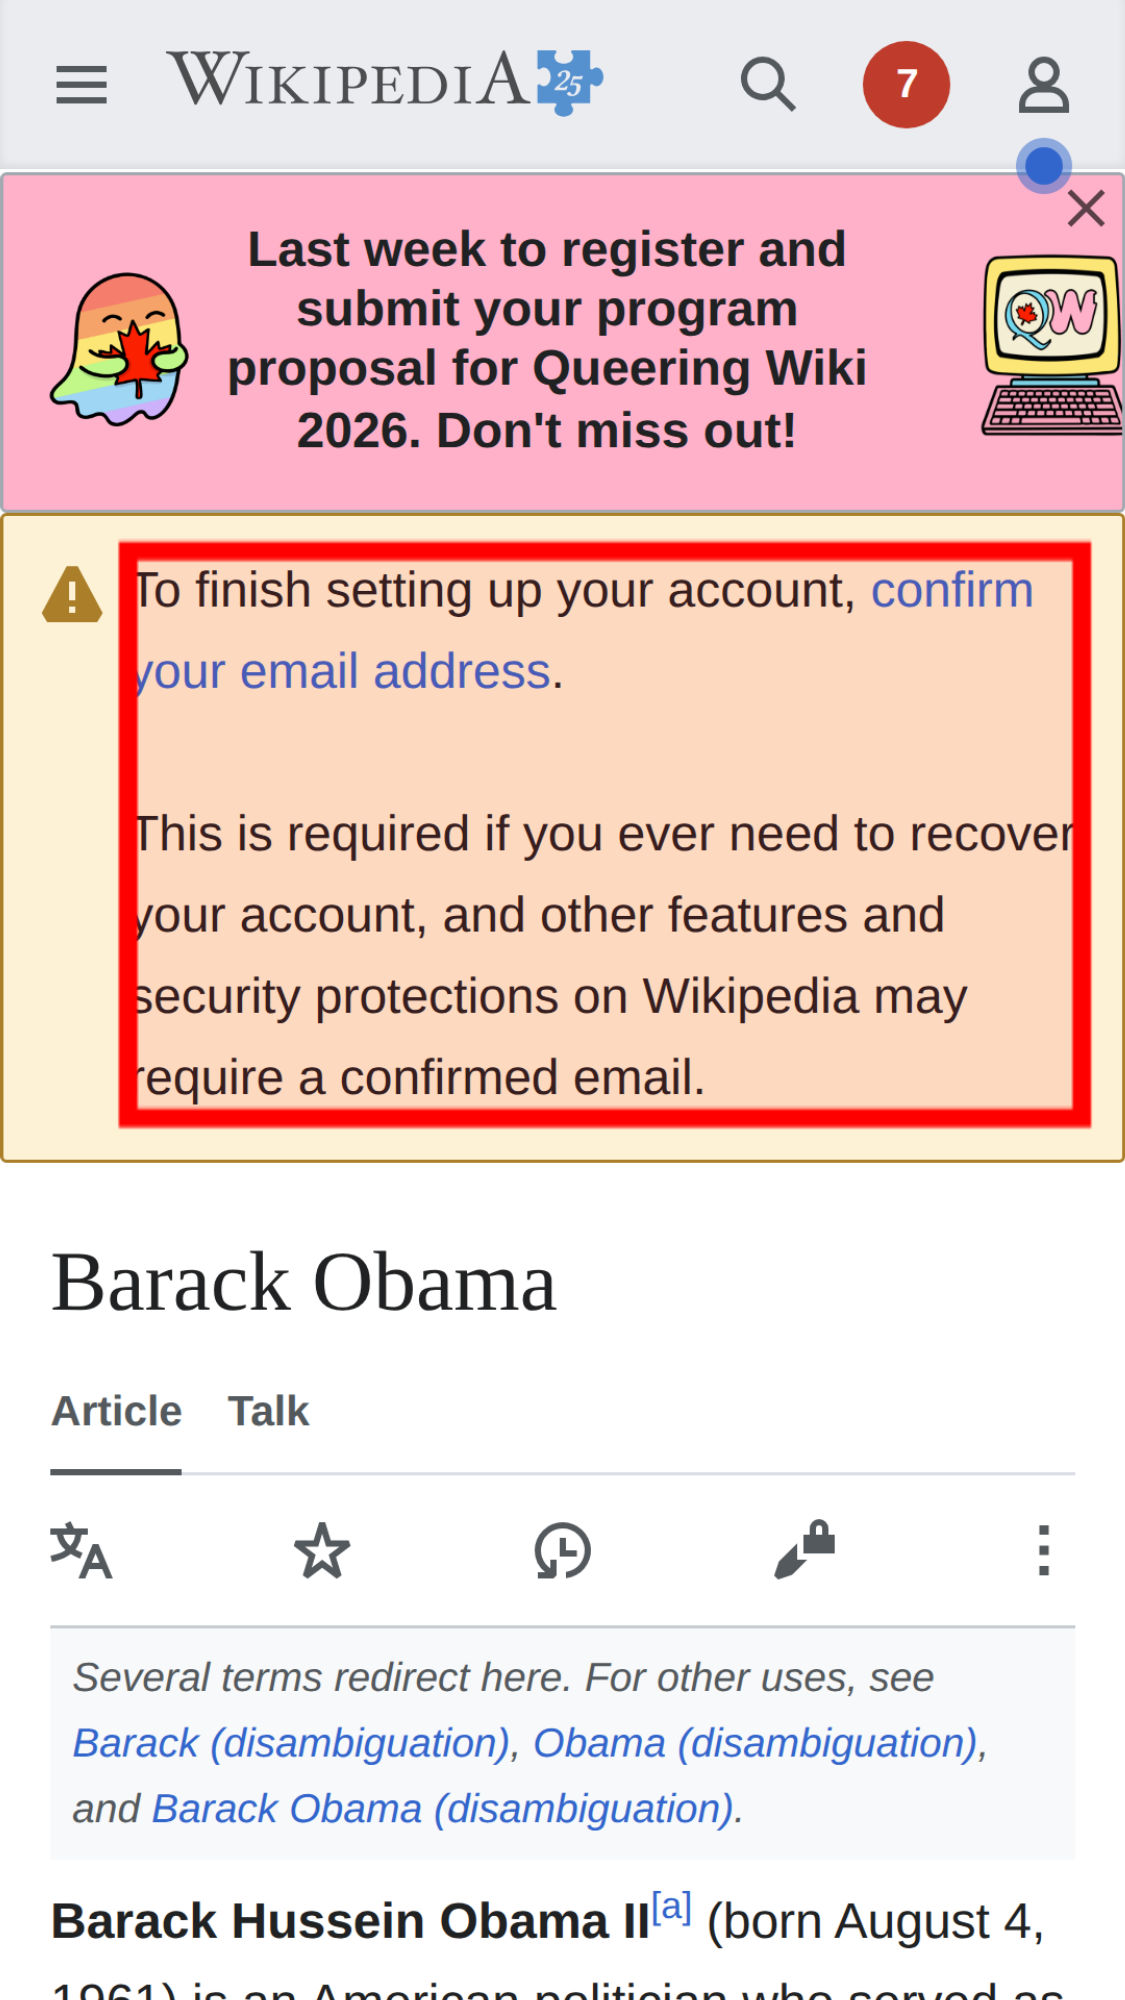
The LCP element is highlighted in the screenshot. If nothing is highlighted the element was removed before the screenshot or the LCP API couldn't find it.
How much the page's content shifts as it loads, collected via the Cumulative Layout Shift API.
Sorted by individual shift score (higher = bigger shift). The top entries usually account for most of the page's CLS.
body > div#mw-mf-viewport > div#mw-mf-page-center > main#content > div:eq(0) > div#siteNotice > div:eq(1),body > div#mw-mf-viewport > div#mw-mf-page-center > main#content > div:eq(1),body > div#mw-mf-viewport > div#mw-mf-page-center > main#content > div#bodyContent,body > div#mw-mf-viewport > div#mw-mf-page-center > main#content > div:eq(1) > nav > ul#p-views,body > div#mw-mf-viewport > div#mw-mf-page-center > main#content > div:eq(0) > div#siteNotice > div:eq(1) > span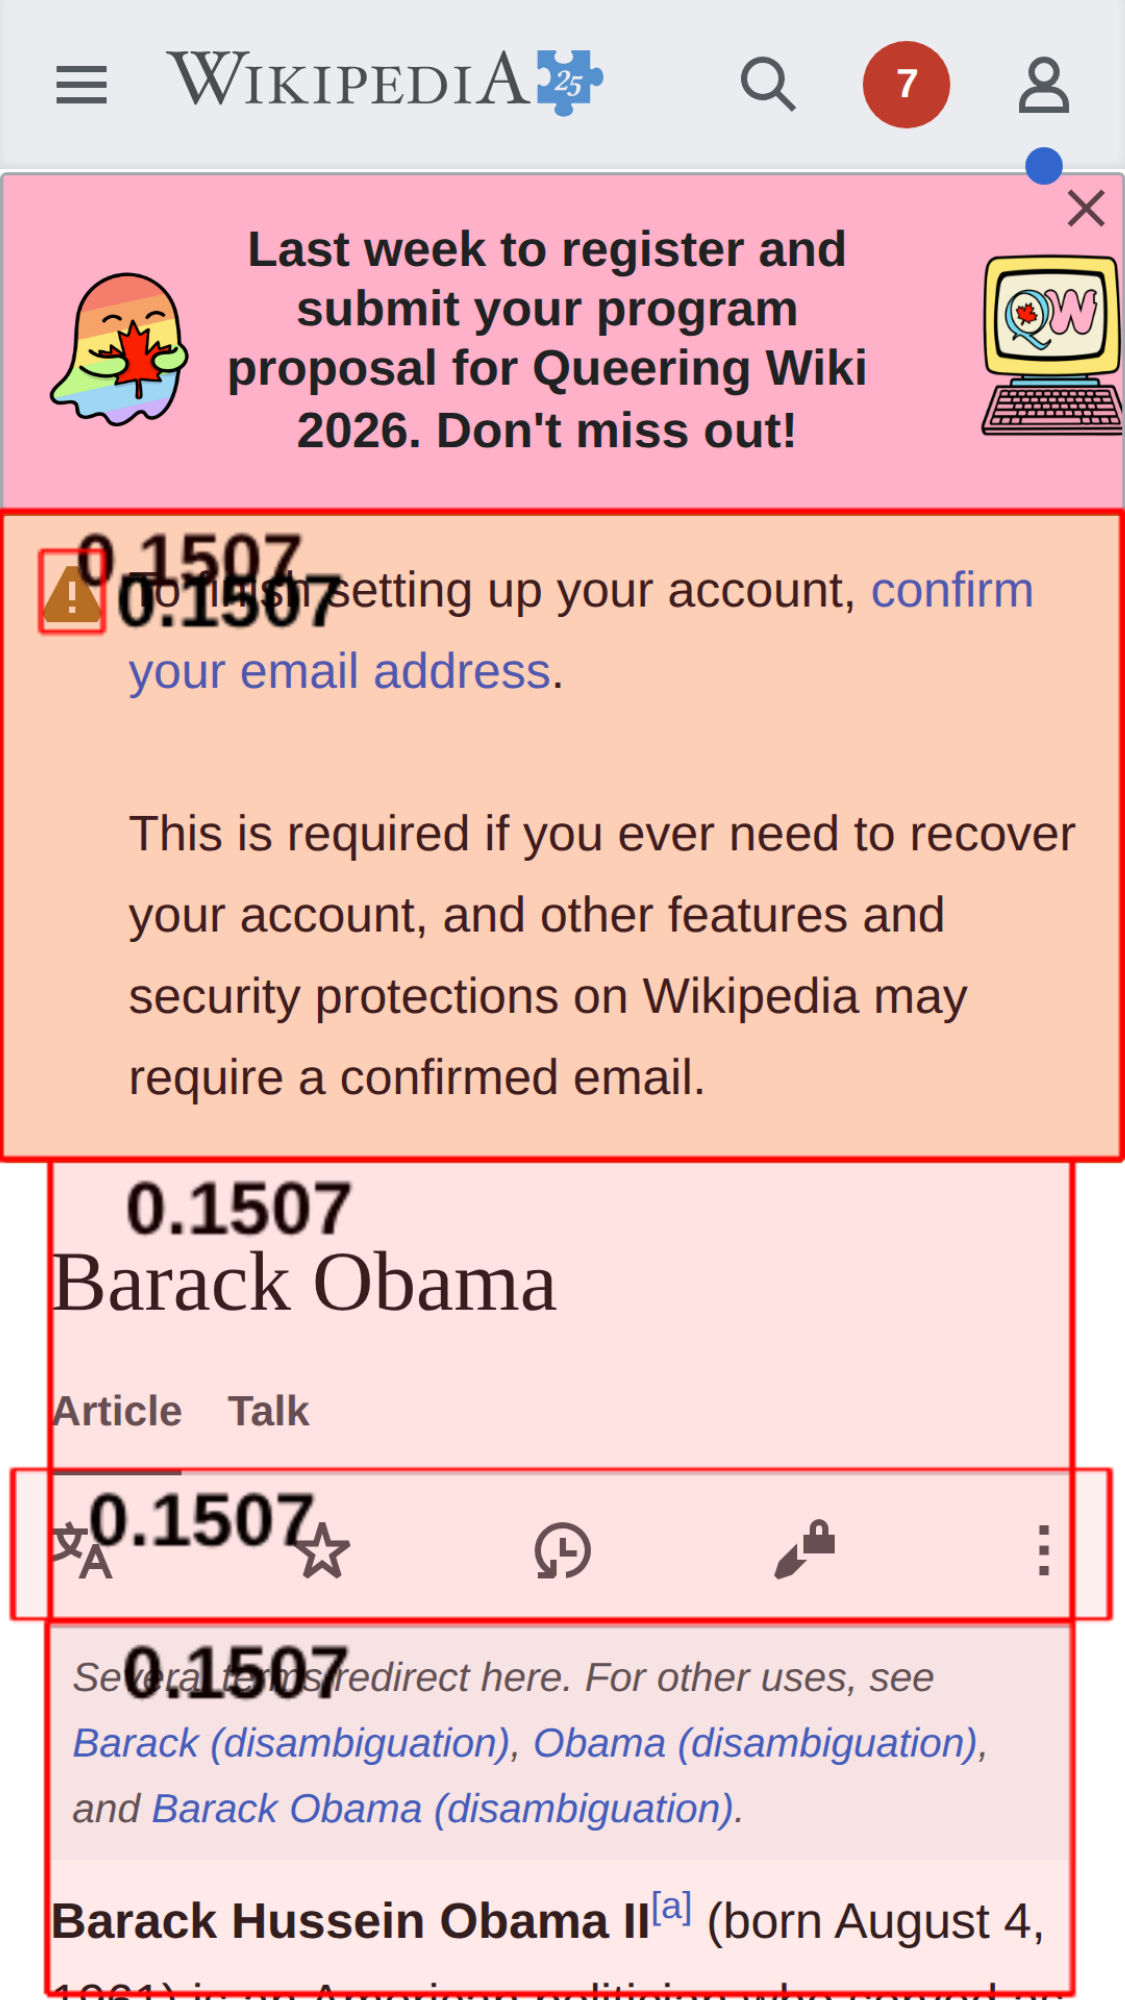
Elements that shifted by more than 0.01 are highlighted in the screenshot. If an element shifted outside the viewport, it won't appear here — check the video or filmstrip to see the shift.
A long animation frame (LOAF) is a frame that took ≥ 50 ms from input to the next paint. The breakdown shows where that time went. Read more about the Long Animation Frames API.
Showing the top 10 longest animation frames.
No script attribution available for this frame.
| Name | Duration | Description |
|---|---|---|
cache | 0 ms | pass |
host | 0 ms | cp3070 |
WMF-Uniq | 0 ms | attribution-research-2026-06-run=treatment;we-1-8-account-creation-form-v2=treatment; |
There are no custom configured scripts.
There are no custom extra metrics from scripting.

How the page is built.
| Content | Header Size | Transfer Size | Content Size | Requests |
|---|---|---|---|---|
| html | 0 b | 349.8 KB | 2.3 MB | 1 |
| css | 0 b | 30.2 KB | 244.3 KB | 1 |
| javascript | 0 b | 91.6 KB | 374.1 KB | 3 |
| image | 0 b | 216.7 KB | 210.1 KB | 4 |
| svg | 0 b | 13.8 KB | 4.3 KB | 11 |
| plain | 0 b | 984 B | 0 b | 1 |
| Total | 0 b | 703.0 KB | 3.1 MB | 21 |
| Domain | Total download time | Transfer Size | Content Size | Requests |
|---|---|---|---|---|
| en.wikipedia.org | 6.977 s | 483.2 KB | 2.9 MB | 16 |
| upload.wikimedia.org | 733 ms | 216.7 KB | 210.1 KB | 4 |
| meta.wikimedia.org | 102 ms | 3.1 KB | 7.2 KB | 1 |
| type | min | median | max |
|---|---|---|---|
| Expires | 0 seconds | 4 weeks | 4 weeks |
| Last modified | 42 seconds | 2 weeks | 1 year |
Includes requests done after load event end.
| Content | Transfer Size | Requests |
|---|---|---|
| html | 0 b | 0 |
| css | 0 b | 0 |
| javascript | 41.6 KB | 2 |
| image | 160.2 KB | 2 |
| font | 0 b | 0 |
| favicon | 0 b | 0 |
| plain | 984 B | 1 |
| Total | 202.8 KB | 5 |
Includes requests done after DOM content loaded.
| Content | Transfer Size | Requests |
|---|---|---|
| html | 0 b | 0 |
| css | 0 b | 0 |
| javascript | 41.6 KB | 2 |
| image | 160.2 KB | 2 |
| font | 0 b | 0 |
| favicon | 0 b | 0 |
| plain | 984 B | 1 |
| Total | 202.8 KB | 5 |
Render blocking information directly from Chrome.
| Blocking | In body parser blocking | Potentially blocking |
|---|---|---|
| 1 | 0 | 0 |
| URL | Type |
|---|---|
| https://en.wikipedia...ia.org/w/load.php | nonblocking |
| https://en.wikipedia...ia.org/w/load.php | nonblocking |
| https://en.wikipedia...ia.org/w/load.php | blocking |
| https://meta.wikimed...a.org/w/index.php | nonblocking |
Download the Chrome trace and drag-and-drop it into Performance in DevTools.
Tasks ≥ 50 ms blocking the main thread, collected via the Long Task API.
How much each script blocked the main thread, derived from the Long Animation Frame API. The script that started each long frame is credited with the frame's blocking time — the closest answer to "which script should I fix to improve TBT" the platform exposes.
Calculated from the Chrome trace.
A forced reflow happens when JavaScript reads a layout-triggering property (offsetTop, getBoundingClientRect, …) inside a handler, forcing the browser to synchronously recompute layout. The scripts below caused most of the page's reflows — fix them in priority order.
Each long animation frame reports how much time each script spent forcing synchronous style and layout — i.e. JavaScript reading layout-triggering properties mid-execution. Same actionable answer as forced reflows above but measured directly by the browser instead of inferred from the trace.
Animations that fell back from the compositor to the main thread, blocking each frame instead of running on the GPU. Each chip below is a CSS property the page tried to animate that Chrome couldn't hand to the compositor — swap it for a transform or opacity equivalent where you can.
color1×