Tested 2026-03-28 00:26:34 using Chrome 146.0.7680.80 (runtime settings).
| Metric | Value |
|---|---|
| Page metrics | |
| Performance score | 92 |
| Total page size | 11.6 KB |
| Requests | 3 |
| Timing metrics | |
| TTFB | 23.226 s |
| First Paint | 23.272 s |
| Fully Loaded | 23.836 s |
| Google Web Vitals | |
| TTFB | 23.226 s |
| First Contentful Paint (FCP) | 23.272 s |
| Largest Contentful Paint (LCP) | 23.656 s |
| Cumulative Layout Shift (CLS) | 0.00 |
| Visual Metrics | |
| First Visual Change | 23.266 s |
| Speed Index | 23.378 s |
| Visual Complete 85% | 23.666 s |
| Visual Complete 99% | 23.666 s |
| Last Visual Change | 23.666 s |
Use--filmstrip.showAll to show all filmstrips.
 0 s
0 s 23.3 sDOM Content Loaded Time 23.240 sFirst Visual Change 23.266 sFirst Contentful Paint 23.272 s
 23.4 s
 23.5 s
 23.6 s
 23.7 sPage Load Time 23.634 sLCP <IMG> 23.656 sLast Visual Change 23.666 sVisual Complete 85% 23.666 sVisual Complete 95% 23.666 sVisual Complete 99% 23.666 sLargest Image 23.666 sHeading 23.666 s
The coach helps you find performance problems on your web page using web performance best practice rules. And gives you advice on privacy and best practices. Tested using Coach-core version 8.1.3.

| Title | Advice | Score |
|---|---|---|
| Have a fast first contentful paint (firstContentfulPaint) | First contentful paint is poor (23.272 s). It is in the Google Web Vitals poor range, slower than 3 seconds.The page has a high time to first byte (TTFB) 23.226 s that you should look into to improve first contentful paint. | 0 |
| Description: The First Contentful Paint (FCP) metric measures the time from when the page starts loading to when any part of the page content is rendered on the screen. For this metric, "content" refers to text, images (including background images), <svg> elements, or non-white <canvas> elements. | ||
| Have a fast largest contentful paint (largestContentfulPaint) | Largest contentful paint is poor 23.656 s. It is in the Google Web Vitals poor range, slower than 4.5 seconds. You can add fetchPriority="high" to the image to increase the load priority in Chrome. | 0 |
| Description: Largest contentful paint is one of Google Web Vitals and reports the render time of the largest image or text block visible within the viewport, relative to when the page first started loading. To be fast according to Google, it needs to render before 2.5 seconds and results over 4 seconds is poor performance. | ||
| Offenders: | ||
| Avoid missing and error requests (responseOk) | The page has 1 error response. The page has 1 response with code 503. | 90 |
| Description: Your page should never request assets that return a 400 or 500 error. These requests are never cached. If that happens something is broken. Please fix it. | ||
| Offenders: | ||
| Title | Advice | Score |
|---|---|---|
| Meta description (metaDescription) | The page is missing a meta description. | 0 |
| Description: Use a page description to make the page more relevant to search engines. | ||
| Do not send too long headers (longHeaders) | https://en.wikipedia...wiki/Barack_Obama has a header content-security-policy that is 1388 characters long. https://en.wikipedia...wiki/Barack_Obama has a header content-security-policy-report-only that is 1397 characters long. | 98 |
| Description: Do not send response headers that are too long. | ||
| Offenders: | ||
| Avoid too many third party requests (thirdParty) | The page do 33% requests to third party domains (1 requests and 4.7 kB). First party is 2 requests and 7.2 kB. The regex .*wmcloud.* was used to calculate first/third party requests. | 50 |
| Description: Do not load most of your content from third party URLs. | ||
| Avoid unnecessary headers (unnecessaryHeaders) | There are 1 response that sets both a max-age and expires header. There are 3 responses that sets a server header. | 96 |
| Description: Do not send headers that you don't need. We look for p3p, cache-control and max-age, pragma, server and x-frame-options headers. Have a look at Andrew Betts - Headers for Hackers talk as a guide https://www.youtube.com/watch?v=k92ZbrY815c or read https://www.fastly.com/blog/headers-we-dont-want. | ||
| Offenders: | ||
| Title | Advice | Score |
|---|---|---|
| Set a referrer-policy header to make sure you do not leak user information. (referrerPolicyHeader) | Set a referrer-policy header to make sure you do not leak user information. | 0 |
| Description: Referrer Policy is a new header that allows a site to control how much information the browser includes with navigations away from a document and should be set by all sites. https://scotthelme.co.uk/a-new-security-header-referrer-policy/. | ||
| Offenders: | ||
| Avoid third party cookies that is used to track the user. (thirdPartyCookies) | The page sets 1 third party cookie. | 0 |
| Description: Third party cookies are used to track the user. They are automatically blocked in Safari and Firefox. | ||
| Offenders: | ||
| Page info | |
|---|---|
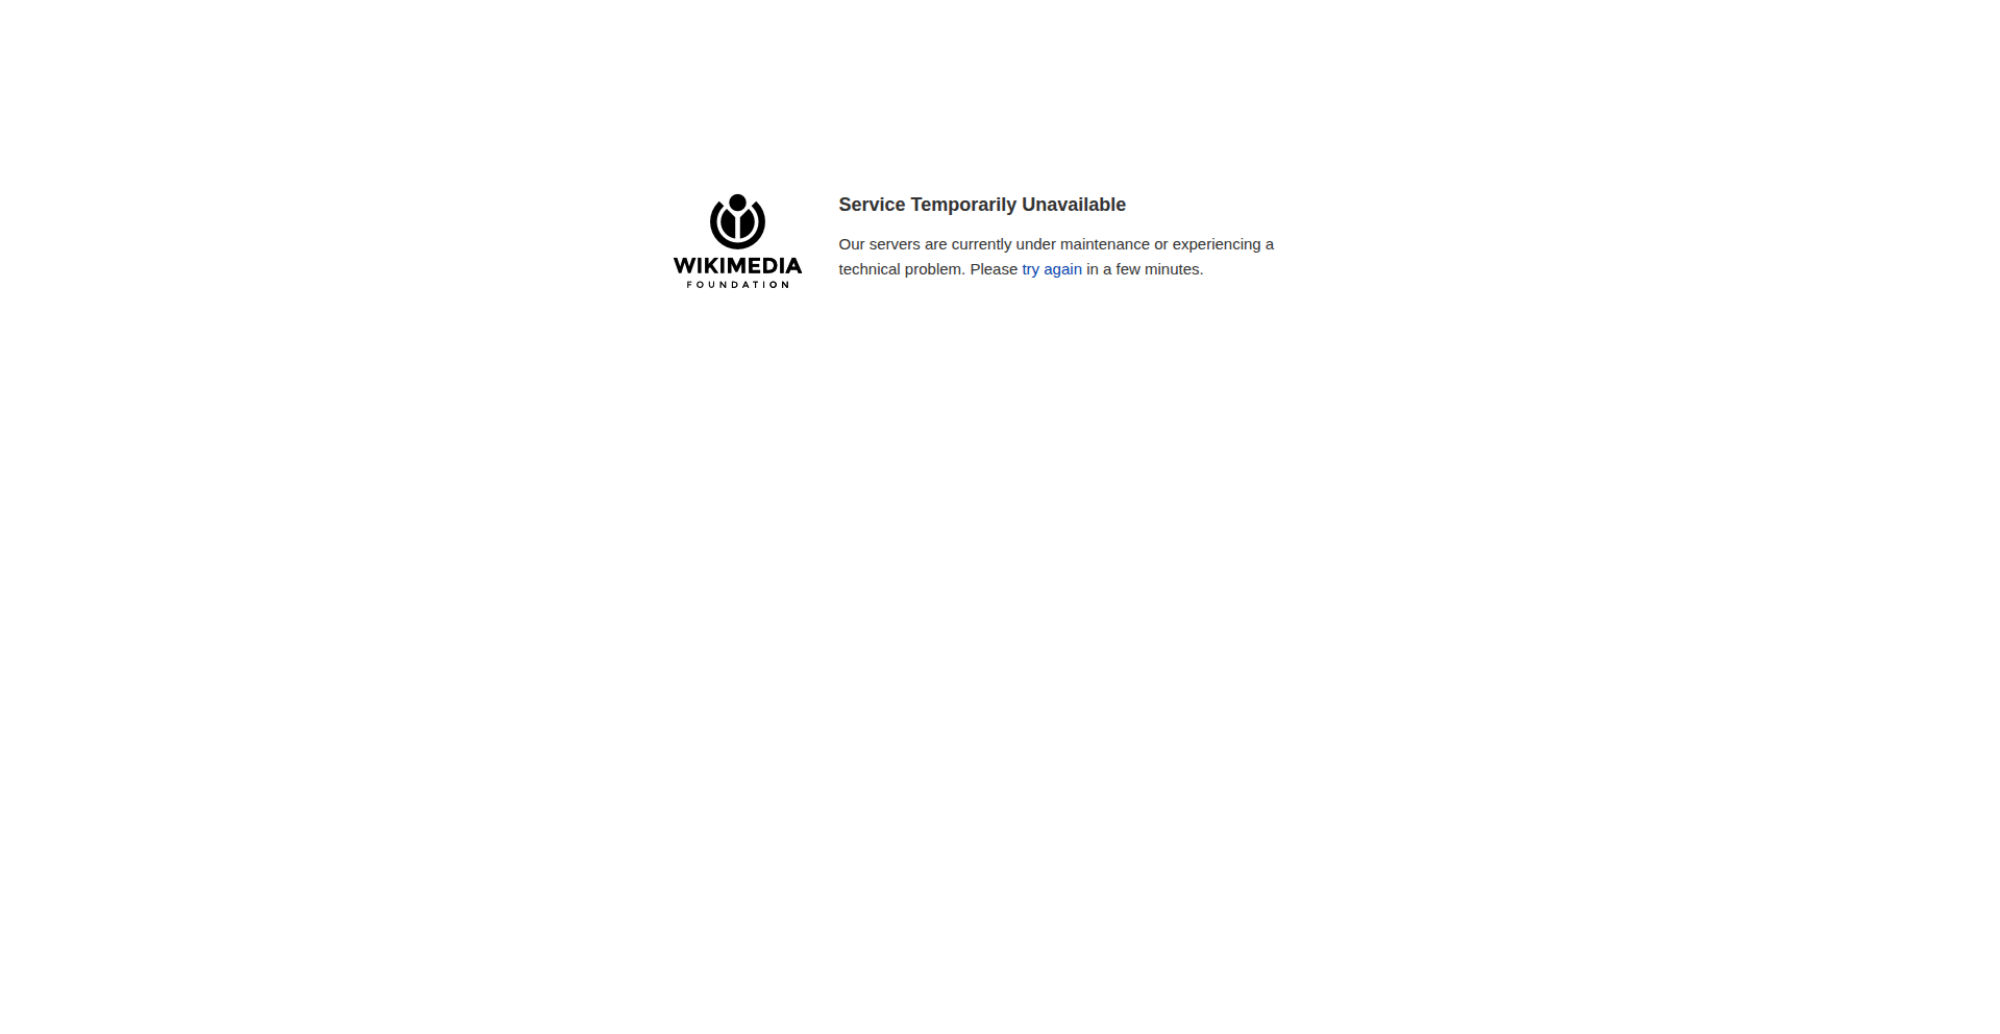
| Title | Wikimedia Error |
| Width | 1919 |
| Height | 992 |
| DOM elements | 13 |
| Avg DOM depth | 3 |
| Max DOM depth | 5 |
| Iframes | 0 |
| Script tags | 0 |
| Local storage | 0 b |
| Session storage | 0 b |
| Network Information API | 4g |
Data collected using Wappalyzer version 6.10.54. With updated code from Webappanalyzer 2024-12-27. Use --browsertime.firefox.includeResponseBodies htmlor --browsertime.chrome.includeResponseBodies htmlto help Wappalyzer find more information about technologies used.
| Technology | Confidence | Category |
|---|---|---|
| Amazon Web Services | 100 | PaaS |
| Apache Traffic Server 9.2.11 | 100 | Web servers |
| HSTS | 100 | Security |
| Amazon S3 | 100 | CDN |
| Visual Metrics | |
|---|---|
| First Visual Change | 23.266 s |
| Speed Index | 23.378 s |
| Largest Image | 23.666 s |
| Heading | 23.666 s |
| LargestContentfulPaint | 23.666 s |
| Last Meaningful Paint | 23.666 s |
| Largest Contentful Paint | 23.666 s |
| Visual Complete 85% | 23.666 s |
| Visual Complete 95% | 23.666 s |
| Visual Complete 99% | 23.666 s |
| Last Visual Change | 23.666 s |
| Visual Readiness | 400 ms |
| Navigation Timing | |
|---|---|
| backEndTime | 23.226 s |
| domContentLoadedTime | 23.240 s |
| domInteractiveTime | 23.240 s |
| domainLookupTime | 108 ms |
| frontEndTime | 407 ms |
| pageDownloadTime | 2 ms |
| pageLoadTime | 23.634 s |
| redirectionTime | 0 ms |
| serverConnectionTime | 398 ms |
| serverResponseTime | 22.717 s |
| Google Web Vitals | |
|---|---|
| Time to first byte (TTFB) | 23.226 s |
| First Contentful Paint (FCP) | 23.272 s |
| Largest Contentful Paint (LCP) | 23.656 s |
| Total Blocking Time (TBT) | 0 ms |
| First Contentful Paint info | |
|---|---|
| Elements that needed recalculate style before FCP | 11 |
| Time spent in recalculate style before FCP | 0.587 ms |
| Extra timings | |
|---|---|
| TTFB | 23.226 s |
| First Paint | 23.272 s |
| Load Event End | 23.634 s |
| Fully loaded | 23.836 s |
When in time the page main content is rendered (collected using the Largest Contentful Paint API). Read more about Largest Contentful Paint.
| Element type | IMG |
| Element/tag | <img id="logo" src="https://www.wikimedia.org/static/images/wmf.png" srcset="https://www.wikimedia.org/static/images/wmf-2x.png 2x" alt="Wikimedia" width="135" height="135"> |
| Render time | 23.656 s |
| Element render delay | 23 ms |
| TTFB | 23.226 s |
| Resource delay | 10 ms |
| Resource load duration | 397 ms |
| Elements that needed recalculate style before LCP | 11 |
| Time spent in recalculate style before LCP | 0.587 ms |
| Element id | logo |
| Load time | 23.634 s |
| URL | https://www.wikimedi...ic/images/wmf.png |
| Size (width*height) | 18225 |
| DOM path | |
| div > a > img#logo> div > a > img#logo> | |
The largest contentful paint is highlighted in the image. If no element is highlighted the element was removed before the screenshot or the LCP API couldn't find the element.
The Largest Contentful Paint API highlighted this image as a part of the LCP.

No layout shift detected.
Read more about the Long Animation Frames API here here.
The top 10 longest animation frames entries
| name | duration | description |
|---|---|---|
| cache | 0 | miss |
| host | 0 | deployment-cache-text08 |
There are no custom configured scripts.
There are no custom extra metrics from scripting.
| name | value |
|---|---|
| AudioHandlers | 0 |
| AudioWorkletProcessors | 0 |
| Documents | 1 |
| Frames | 1 |
| JSEventListeners | 1 |
| LayoutObjects | 15 |
| MediaKeySessions | 0 |
| MediaKeys | 0 |
| Nodes | 30 |
| Resources | 1 |
| ContextLifecycleStateObservers | 9 |
| V8PerContextDatas | 1 |
| WorkerGlobalScopes | 0 |
| UACSSResources | 0 |
| RTCPeerConnections | 0 |
| ResourceFetchers | 1 |
| AdSubframes | 0 |
| DetachedScriptStates | 0 |
| ArrayBufferContents | 0 |
| LayoutCount | 1 |
| RecalcStyleCount | 3 |
| LayoutDuration | 4 |
| RecalcStyleDuration | 1 |
| DevToolsCommandDuration | 10 |
| ScriptDuration | 0 |
| V8CompileDuration | 0 |
| TaskDuration | 43 |
| TaskOtherDuration | 28 |
| ThreadTime | 1 |
| ProcessTime | 5 |
| JSHeapUsedSize | 1091396 |
| JSHeapTotalSize | 1835008 |
| FirstMeaningfulPaint | 23272 |
| Name | Display Time | X | Y | Width | Height |
|---|---|---|---|---|---|
| LargestImage (wmf.png) | 23.666 s | 640 | 164 | 135 | 135 |
| <img id="logo" src="https://www.wikimedia.org/static/images/wmf.png" srcset="https://www.wikimedia.org/static/images/wmf-2x.png 2x" alt="Wikimedia" width="135" height="135"> | |||||
| Heading | 23.666 s | 640 | 182 | 640 | 29 |
| <h1></h1> | |||||
| LargestContentfulPaint (wmf.png) | 23.666 s | 640 | 164 | 135 | 135 |
| <img id="logo" src="https://www.wikimedia.org/static/images/wmf.png" srcset="https://www.wikimedia.org/static/images/wmf-2x.png 2x" alt="Wikimedia" width="135" height="135"> | |||||
How the page is built.
| Summary | |
|---|---|
| HTTP version | HTTP/2.0 |
| Total requests | 3 |
| Total domains | 2 |
| Total transfer size | 11.6 KB |
| Total content size | 5.8 KB |
| Responses missing compression | 0 |
| Number of cookies | 3 |
| Third party cookies | 1 |
| Requests per response code | |
|---|---|
| 200 | 2 |
| 503 | 1 |
| URL | Type | Transfer Size | Content Size |
|---|---|---|---|
| https://en.wikipedia...wiki/Barack_Obama | html | 4.8 KB | 1.2 KB |
| https://www.wikimedi...ic/images/wmf.png | image | 4.6 KB | 3.4 KB |
| https://en.wikipedia...d.org/favicon.ico | image | 2.2 KB | 1.2 KB |
| Content | Header Size | Transfer Size | Content Size | Requests |
|---|---|---|---|---|
| image | 0 b | 6.7 KB | 4.6 KB | 2 |
| Total | 0 b | 6.7 KB | 4.6 KB | 2 |
| Domain | Total download time | Transfer Size | Content Size | Requests |
|---|---|---|---|---|
| en.wikipedia.beta.wmcloud.org | 23.627 s | 7.0 KB | 2.4 KB | 2 |
| www.wikimedia.org | 501 ms | 4.6 KB | 3.4 KB | 1 |
| type | min | median | max |
|---|---|---|---|
| Expires | 0 seconds | 1 year | 1 year |
| Last modified | 21 weeks | 1 year | 2 years |
The page logs the following messages to the console.
| Level | Message |
|---|---|
| SEVERE | https://en.wikipedia.beta.wmcloud.org/wiki/Barack_Obama - Failed to load resource: the server responded with a status of 503 () |
Included requests done after load event end.
| Content | Transfer Size | Requests |
|---|---|---|
| html | 0 b | 0 |
| css | 0 b | 0 |
| javascript | 0 b | 0 |
| image | 2.2 KB | 1 |
| font | 0 b | 0 |
| Total | 2.2 KB | 1 |
Includes requests done after DOM content loaded.
| Content | Transfer Size | Requests |
|---|---|---|
| html | 0 b | 0 |
| css | 0 b | 0 |
| javascript | 0 b | 0 |
| image | 2.2 KB | 1 |
| font | 0 b | 0 |
| Total | 2.2 KB | 1 |
Download the Chrome trace log and drag and drop it into Developer Tools / Performance in Chrome.
Collected using the Long Task API. A long task is a task that take 50 milliseconds or more.
Calculated using Tracium.
| Categories (ms) | |
|---|---|
| parseHTML | 1 |
| styleLayout | 5 |
| paintCompositeRender | 1 |
| scriptParseCompile | 0 |
| scriptEvaluation | 3 |
| garbageCollection | 2 |
| other | 48 |
| Events (ms) | |
|---|---|
| RunTask | 29 |
| CpuProfiler::StartProfiling | 11 |

afterPageCompleteCheck.jpg

layoutShift.jpg

largestContentfulPaint.jpg