The coach helps you find performance problems on your web page using web performance best practice rules. And gives you advice on privacy and best practices. Tested using Coach-core version 8.1.3.
Avoid slowing down the critical rendering path (avoidRenderBlocking)
The page has 1 blocking requests and 1 in body parser blocking (2 JavaScript and 0 CSS).
80
Description: The critical rendering path is what the browser needs to do to start rendering the page. Every file requested inside of the head element will postpone the rendering of the page, because the browser need to do the request. Avoid loading JavaScript synchronously inside of the head (you should not need JavaScript to render the page), request files from the same domain as the main document (to avoid DNS lookups) and inline CSS for really fast rendering and a short rendering path.
Have a fast largest contentful paint (largestContentfulPaint)
Largest contentful paint can be improved 3.116 s. It is in the Google Web Vitals needs improvement range, slower than 2.5 seconds.
80
Description: Largest contentful paint is one of Google Web Vitals and reports the render time of the largest image or text block visible within the viewport, relative to when the page first started loading. To be fast according to Google, it needs to render before 2.5 seconds and results over 4 seconds is poor performance.
The page has 5 CPU long tasks with the total of 2.219 s. The total blocking time is 132 ms and 3 long tasks before first contentful paint with total time of 1.987 s. However the CPU Long Task is depending on the computer/phones actual CPU speed, so you should measure this on the same type of the device that your user is using. Use Geckoprofiler for Firefox or Chromes tracelog to debug your long tasks.
0
Description: Long CPU tasks locks the thread. To the user this is commonly visible as a "locked up" page where the browser is unable to respond to user input; this is a major source of bad user experience on the web today. However the CPU Long Task is depending on the computer/phones actual CPU speed, so you should measure this on the same type of the device that your user is using. To debug you should use the Chrome timeline log and drag/drop it into devtools or use Firefox Geckoprofiler.
Offenders:
unknown
unknown
unknown
unknown
self
Long cache headers is good (cacheHeadersLong)
The page has 7 requests that have a shorter cache time than 30 days (but still a cache time).
93
Description: Setting a cache header is good. Setting a long cache header (at least 30 days) is even better beacause then it will stay long in the browser cache. But what do you do if that asset change? Rename it and the browser will pick up the new version.
Use a good Content-Security-Policy header to make sure you you avoid Cross Site Scripting (XSS) attacks. (contentSecurityPolicyHeader)
Set a Content-Security-Policy header to make sure you are not open for Cross Site Scripting (XSS) attacks. You can start with setting a Content-Security-Policy-Report-Only header, that will only report the violation, not stop the download.
0
Description: Content Security Policy is delivered via a HTTP response header, and defines approved sources of content that the browser may load. It can be an effective countermeasure to Cross Site Scripting (XSS) attacks and is also widely supported and usually easily deployed. https://scotthelme.co.uk/content-security-policy-an-introduction/.
Set a referrer-policy header to make sure you do not leak user information. (referrerPolicyHeader)
Set a referrer-policy header to make sure you do not leak user information.
0
Description: Referrer Policy is a new header that allows a site to control how much information the browser includes with navigations away from a document and should be set by all sites. https://scotthelme.co.uk/a-new-security-header-referrer-policy/.
Data collected using Wappalyzer version 6.10.54. With updated code from Webappanalyzer 2024-12-27. Use --browsertime.firefox.includeResponseBodies htmlor --browsertime.chrome.includeResponseBodies htmlto help Wappalyzer find more information about technologies used.
main > div:eq(1) > video#wikipedia25-video> main > div:eq(1) > video#wikipedia25-video>
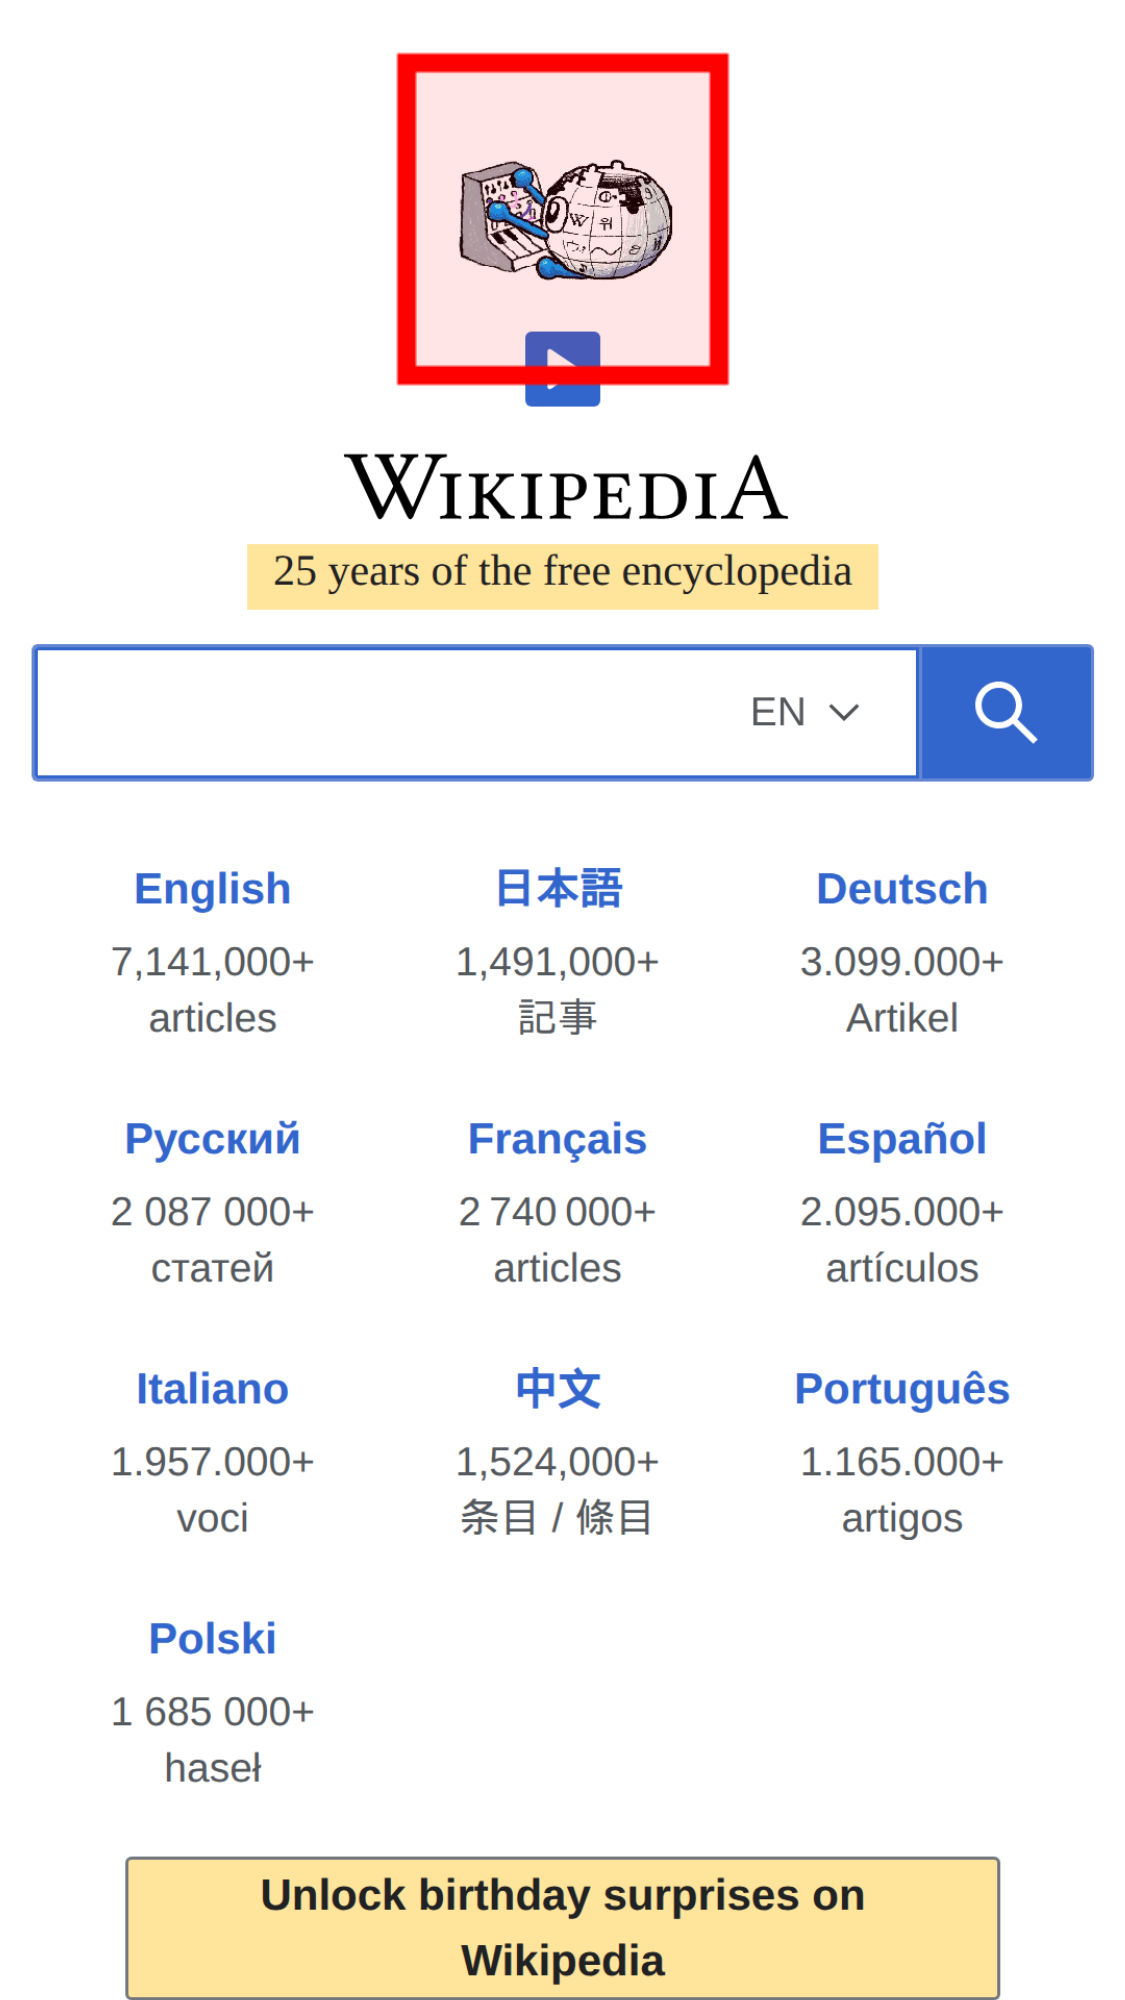
The largest contentful paint is highlighted in the image. If no element is highlighted the element was removed before the screenshot or the LCP API couldn't find the element.
The Largest Contentful Paint API highlighted this image as a part of the LCP.
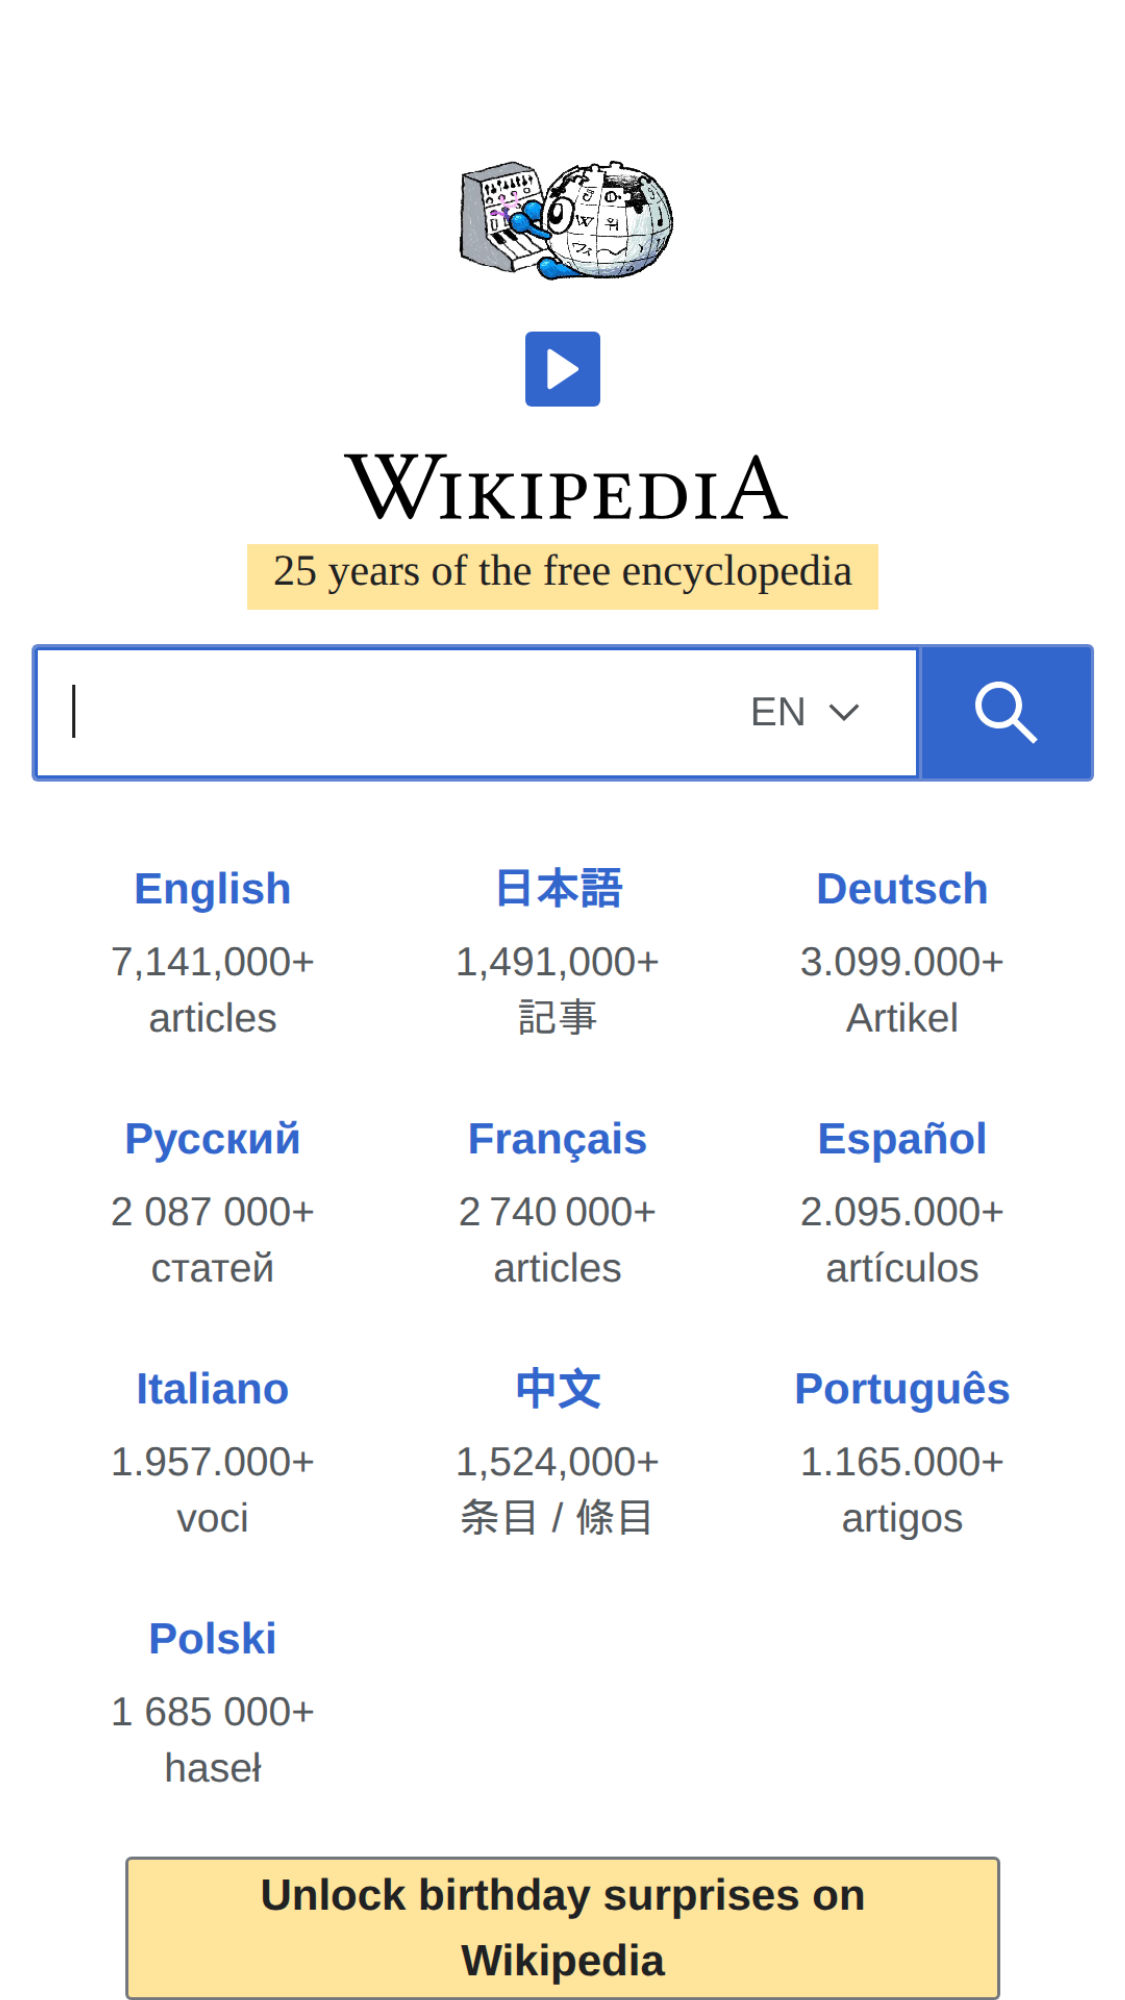
The elements that have shifted place is highlighted in the image (that have a higher value than 0.01). If the element shifted outside of the viewport, you will not see it there. It can be hard to understand what content that has shifted, if that's the case, checkout the video or the filmstrip of the run.
Interaction to Next Paint
Interaction to Next Paint (INP) is a metric that try to measure responsiveness. It's useful if you are testing user journeys. Read more about Interaction to Next Paint.
The measured latency was 664 ms.
Event type
pointerover
Element type
HTML
Element class name
js-enabled wikipedia25-birthday-mode-enabled
Event target
html.js-enabled.wikipedia25-birthday-mode-enabled
Load state when the event happened
loading
Long Animation Frames
Read more about the Long Animation Frames API here here.

 0 s
0 s 1.3 sCPU Long Task duration 1.430 sFirst Contentful Paint 1.232 sFirst Visual Change 1.234 s
 1.4 s
1.4 s 1.5 s
1.5 s 1.6 s
1.6 s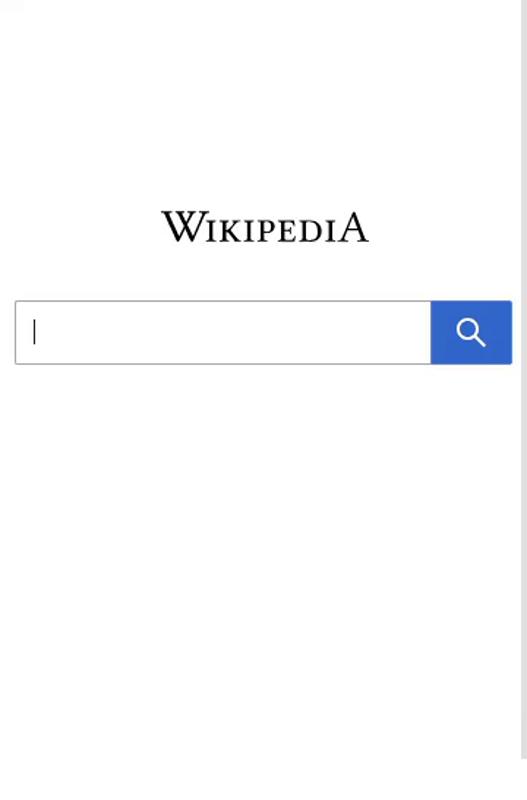 1.7 s
1.7 s 1.8 s
1.8 s 1.9 s
1.9 s 2 s
2 s 2.1 s
2.1 s 2.2 s
2.2 s 2.3 s
2.3 s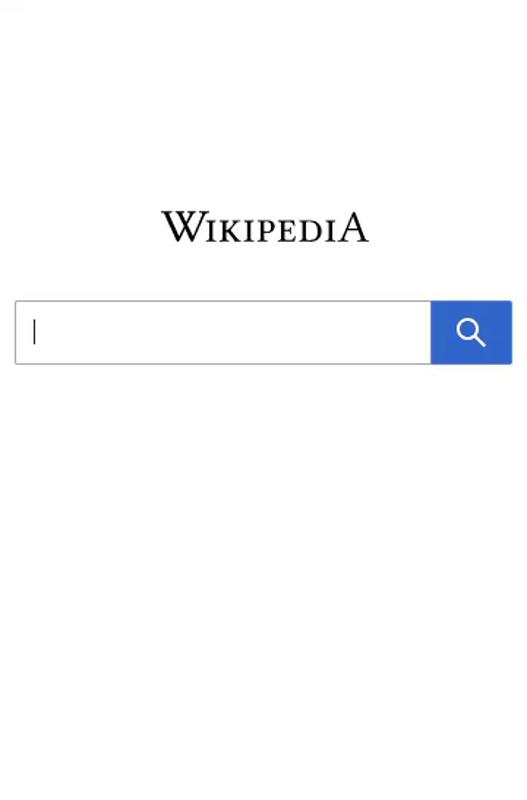 2.4 s
2.4 s 2.5 s
2.5 s 2.6 s
2.6 s 2.7 sCPU Long Task duration 179 ms
 2.8 s
2.8 s 2.9 s
2.9 s 3 sHeading 3.000 s
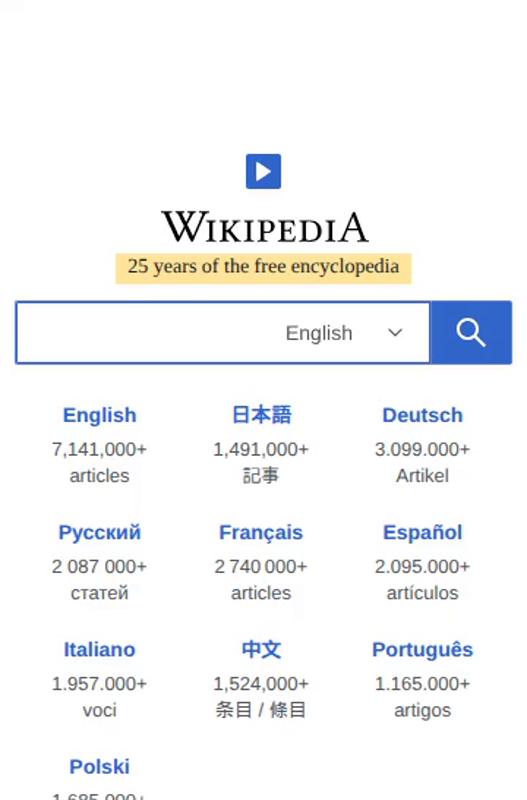 3.1 sCPU Long Task duration 53 msDOM Content Loaded Time 3.021 sLayout Shift 0.00069 3.083 s
 3.2 sLCP <VIDEO> wikipedia25-video 3.116 sVisual Complete 85% 3.134 sPage Load Time 3.180 s
 3.3 sFully Loaded 3.299 s
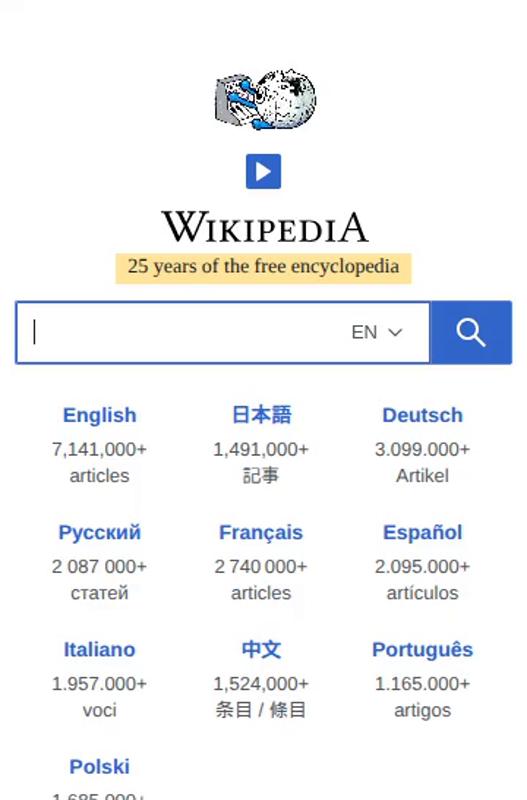 3.4 s
3.4 s 3.5 s
3.5 s 3.6 s
3.6 s 3.7 s
3.7 s 3.8 s
3.8 s 3.9 s
3.9 s 4 s
4 s 4.1 s
4.1 s 4.2 s
4.2 s 4.3 s
4.3 s 4.4 s
4.4 s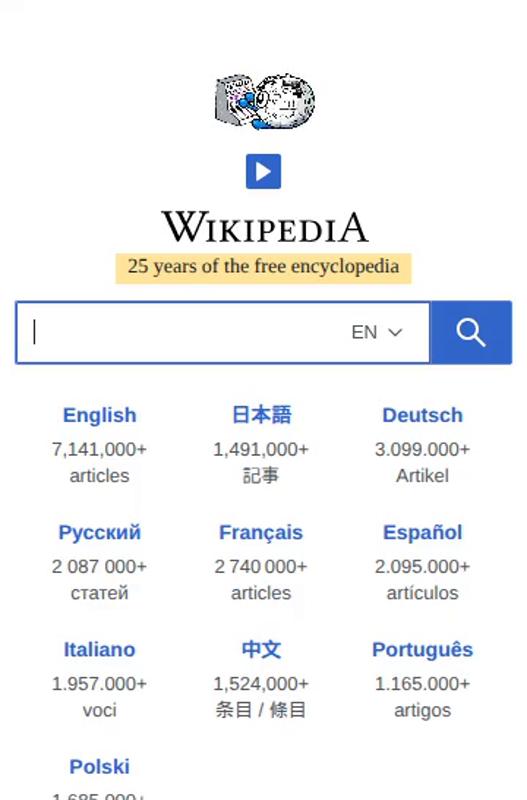 4.5 s
4.5 s 4.6 s
4.6 s 4.7 s
4.7 s 4.8 s
4.8 s 4.9 s
4.9 s 5 s
5 s 5.1 s
5.1 s 5.2 s
5.2 s 5.3 s
5.3 s 5.4 s
5.4 s 5.5 s
5.5 s 5.6 s
5.6 s 5.7 s
5.7 s 5.8 s
5.8 s 5.9 s
5.9 s 6 s
6 s 6.1 s
6.1 s 6.2 s
6.2 s 6.3 s
6.3 s 6.4 s
6.4 s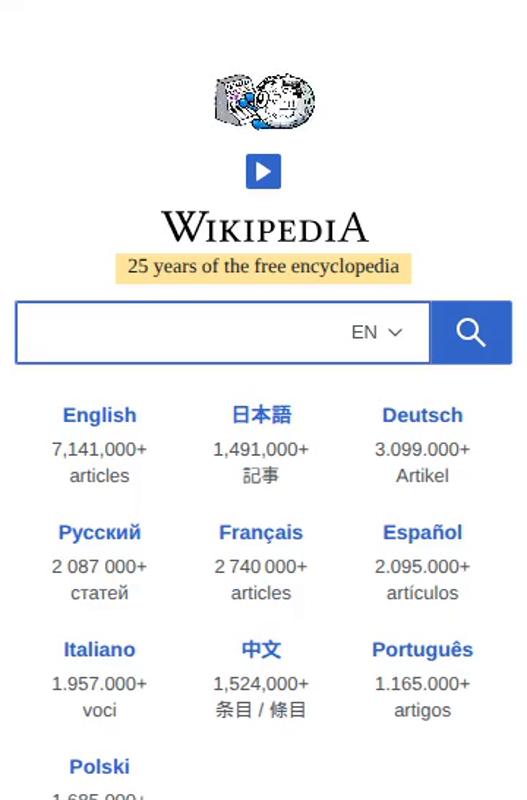 6.5 s
6.5 s 6.6 s
6.6 s 6.7 s
6.7 s 6.8 s
6.8 s 6.9 s
6.9 s 7 s
7 s 7.1 sVisual Complete 95% 7.067 s
 7.2 s
7.2 s 7.3 s
7.3 s 7.4 s
7.4 s 7.5 s
7.5 s 7.6 s
7.6 s 7.7 s
7.7 s 7.8 s
7.8 s 7.9 s
7.9 s 8 s
8 s 8.1 s
8.1 s 8.2 s
8.2 s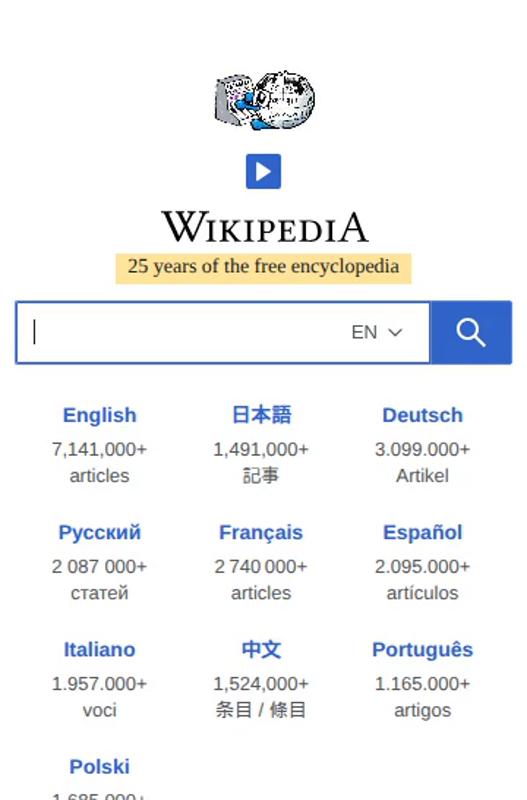 8.3 s
8.3 s 8.4 s
8.4 s 8.5 s
8.5 s 8.6 s
8.6 s 8.7 s
8.7 s 8.8 s
8.8 s 8.9 s
8.9 s 9 s
9 s 9.1 s
9.1 s 9.2 s
9.2 s 9.3 s
9.3 s 9.4 s
9.4 s 9.5 s
9.5 s 9.6 s
9.6 s 9.7 s
9.7 s 9.8 s
9.8 s 9.9 s
9.9 s 10 s
10 s 10.1 s
 10.2 s
 10.3 s
 10.4 s
 10.5 s
 10.6 s
 10.7 s
 10.8 s
 10.9 s
 11 s
11 s 11.1 s
 11.2 s
 11.3 s
 11.4 s
 11.5 s
 11.6 s
 11.7 s
 11.8 s
 11.9 s
 12 s
12 s 12.1 s
 12.2 s
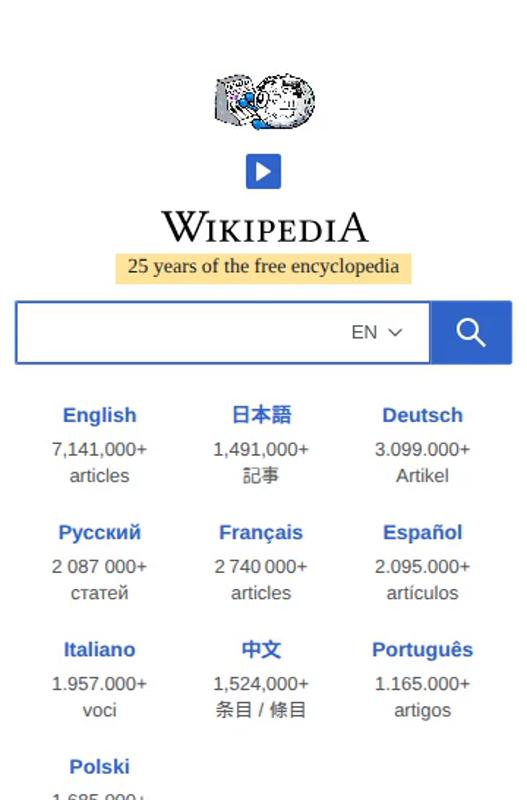 12.3 s
 12.4 s
 12.5 s
 12.6 s
 12.7 s
 12.8 s
 12.9 s
 13 s
13 s 13.1 s
 13.2 s
 13.3 s
 13.4 sVisual Complete 99% 13.400 s
 13.5 sLast Visual Change 13.500 s


