Tested 2026-03-28 04:16:01 using Chrome 146.0.7680.80 (runtime settings).
| Metric | Value |
|---|---|
| Page metrics | |
| Performance Score | 93 |
| Total Page Transfer Size | 276.3 KB |
| Requests | 9 |
| Timing metrics | |
| TTFB [median] | 436 ms |
| First Paint [median] | 1.316 s |
| Fully Loaded [median] | 3.299 s |
| Google Web Vitals | |
| TTFB [median] | 436 ms |
| First Contentful Paint (FCP) [median] | 1.316 s |
| Largest Contentful Paint (LCP) [median] | 3.216 s |
| Cumulative Layout Shift (CLS) [median] | 0.00 |
| Interaction To Next Paint (INP) [median] | 760 ms |
| Total Blocking Time [median] | 146 ms |
| Max Potential FID [median] | 194 ms |
| CPU metrics | |
| CPU long tasks [median] | 5 |
| CPU longest task duration | 1.430 s |
| CPU last long task happens at | 3.006 s |
| Visual Metrics | |
| First Visual Change [median] | 1.334 s |
| Speed Index [median] | 3.485 s |
| Visual Complete 85% [median] | 3.134 s |
| Visual Complete 99% [median] | 13.400 s |
| Last Visual Change [median] | 13.500 s |
| Metric | min | median | mean | max |
|---|---|---|---|---|
| Visual Metrics | ||||
| FirstVisualChange | 1.234 s | 1.334 s | 1.589 s | 2.200 s |
| LastVisualChange | 13.500 s | 13.500 s | 13.500 s | 13.500 s |
| SpeedIndex | 3.437 s | 3.485 s | 3.485 s | 3.532 s |
| Heading | 3.000 s | 3.000 s | 3.000 s | 3.000 s |
| LargestContentfulPaint | 3.666 s | 3.667 s | 3.667 s | 3.667 s |
| LastMeaningfulPaint | 3.666 s | 3.667 s | 3.667 s | 3.667 s |
| VisualReadiness | 11.300 s | 12.166 s | 11.911 s | 12.266 s |
| VisualComplete85 | 3.133 s | 3.134 s | 3.145 s | 3.167 s |
| VisualComplete95 | 7.033 s | 7.067 s | 7.056 s | 7.067 s |
| VisualComplete99 | 13.367 s | 13.400 s | 13.389 s | 13.400 s |
| Google Web Vitals | ||||
| Time To First Byte (TTFB) | 419 ms | 436 ms | 431 ms | 437 ms |
| Largest Contentful Paint (LCP) | 3.116 s | 3.216 s | 3.184 s | 3.220 s |
| First Contentful Paint (FCP) | 1.232 s | 1.316 s | 1.581 s | 2.196 s |
| Cumulative Layout Shift (CLS) | 0.0007 | 0.0007 | 0.0007 | 0.0007 |
| More metrics | ||||
| firstPaint | 1.232 s | 1.316 s | 1.581 s | 2.196 s |
| loadEventEnd | 3.170 s | 3.178 s | 3.176 s | 3.180 s |
| CPU | ||||
| Total Blocking Time | 132 ms | 146 ms | 267 ms | 523 ms |
| Max Potential FID | 179 ms | 194 ms | 315 ms | 573 ms |
| CPU long tasks | 3 | 5 | 4 | 5 |
| CPU last long task happens at | 2.202 s | 3.006 s | 2.742 s | 3.019 s |
Run 3 SpeedIndex median
Use--filmstrip.showAll to show all filmstrips.
 0 s0.6 sCPU Long Task duration 219 ms0.9 sCPU Long Task duration 435 ms
 1.4 sCPU Long Task duration 1.334 sFirst Contentful Paint 1.316 sFirst Visual Change 1.334 s
 1.5 s
1.5 s 1.6 s
1.6 s 1.7 s
1.7 s 1.8 s
1.8 s 1.9 s
1.9 s 2 s
2 s 2.1 s
2.1 s 2.2 s
2.2 s 2.3 s
2.3 s 2.4 s
2.4 s 2.5 s
2.5 s 2.6 s
2.6 s 2.7 sCPU Long Task duration 194 ms
 2.8 s
2.8 s 2.9 s
2.9 s 3 sHeading 3.000 s
 3.1 sCPU Long Task duration 52 msDOM Content Loaded Time 3.007 sLayout Shift 0.00069 3.071 s
 3.2 sVisual Complete 85% 3.167 sPage Load Time 3.170 s
 3.3 sLCP <VIDEO> wikipedia25-video 3.220 sFully Loaded 3.285 s
 3.4 s
3.4 s 3.5 s
3.5 s 3.6 s
3.6 s 3.7 s
3.7 s 3.8 s
3.8 s 3.9 s
3.9 s 4 s
4 s 4.1 s
4.1 s 4.2 s
4.2 s 4.3 s
4.3 s 4.4 s
4.4 s 4.5 s
4.5 s 4.6 s
4.6 s 4.7 s
4.7 s 4.8 s
4.8 s 4.9 s
4.9 s 5 s
5 s 5.1 s
5.1 s 5.2 s
5.2 s 5.3 s
5.3 s 5.4 s
5.4 s 5.5 s
5.5 s 5.6 s
5.6 s 5.7 s
5.7 s 5.8 s
5.8 s 5.9 s
5.9 s 6 s
6 s 6.1 s
6.1 s 6.2 s
6.2 s 6.3 s
6.3 s 6.4 s
6.4 s 6.5 s
6.5 s 6.6 s
6.6 s 6.7 s
6.7 s 6.8 s
6.8 s 6.9 s
6.9 s 7 s
7 s 7.1 sVisual Complete 95% 7.067 s
 7.2 s
7.2 s 7.3 s
7.3 s 7.4 s
7.4 s 7.5 s
7.5 s 7.6 s
7.6 s 7.7 s
7.7 s 7.8 s
7.8 s 7.9 s
7.9 s 8 s
8 s 8.1 s
8.1 s 8.2 s
8.2 s 8.3 s
8.3 s 8.4 s
8.4 s 8.5 s
8.5 s 8.6 s
8.6 s 8.7 s
8.7 s 8.8 s
8.8 s 8.9 s
8.9 s 9 s
9 s 9.1 s
9.1 s 9.2 s
9.2 s 9.3 s
9.3 s 9.4 s
9.4 s 9.5 s
9.5 s 9.6 s
9.6 s 9.7 s
9.7 s 9.8 s
9.8 s 9.9 s
9.9 s 10 s
10 s 10.1 s
 10.2 s
 10.3 s
 10.4 s
 10.5 s
 10.6 s
 10.7 s
 10.8 s
 10.9 s
 11 s
11 s 11.1 s
 11.2 s
 11.3 s
 11.4 s
 11.5 s
 11.6 s
 11.7 s
 11.8 s
 11.9 s
 12 s
12 s 12.1 s
 12.2 s
 12.3 s
 12.4 s
 12.5 s
 12.6 s
 12.7 s
 12.8 s
 12.9 s
 13 s
13 s 13.1 s
 13.2 s
 13.3 s
 13.4 sVisual Complete 99% 13.367 s
 13.5 sLast Visual Change 13.500 s
The coach helps you find performance problems on your web page using web performance best practice rules. And gives you advice on privacy and best practices. Tested using Coach-core version 8.1.3.

| Title | Advice | Score |
|---|---|---|
| Avoid slowing down the critical rendering path (avoidRenderBlocking) | The page has 1 blocking requests and 1 in body parser blocking (2 JavaScript and 0 CSS). | 80 |
| Description: The critical rendering path is what the browser needs to do to start rendering the page. Every file requested inside of the head element will postpone the rendering of the page, because the browser need to do the request. Avoid loading JavaScript synchronously inside of the head (you should not need JavaScript to render the page), request files from the same domain as the main document (to avoid DNS lookups) and inline CSS for really fast rendering and a short rendering path. | ||
| Offenders: | ||
| Have a fast first contentful paint (firstContentfulPaint) | First contentful paint can be improved (2.196 s). It is in the Google Web Vitals needs improvement range, slower than 1.8 seconds. | 50 |
| Description: The First Contentful Paint (FCP) metric measures the time from when the page starts loading to when any part of the page content is rendered on the screen. For this metric, "content" refers to text, images (including background images), <svg> elements, or non-white <canvas> elements. | ||
| Have a fast largest contentful paint (largestContentfulPaint) | Largest contentful paint can be improved 3.216 s. It is in the Google Web Vitals needs improvement range, slower than 2.5 seconds. | 80 |
| Description: Largest contentful paint is one of Google Web Vitals and reports the render time of the largest image or text block visible within the viewport, relative to when the page first started loading. To be fast according to Google, it needs to render before 2.5 seconds and results over 4 seconds is poor performance. | ||
| Offenders: | ||
| Avoid CPU Long Tasks (longTasks) | The page has 3 CPU long tasks with the total of 2.117 s. The total blocking time is 523 ms and 2 long tasks before first contentful paint with total time of 1.544 s. However the CPU Long Task is depending on the computer/phones actual CPU speed, so you should measure this on the same type of the device that your user is using. Use Geckoprofiler for Firefox or Chromes tracelog to debug your long tasks. | 40 |
| Description: Long CPU tasks locks the thread. To the user this is commonly visible as a "locked up" page where the browser is unable to respond to user input; this is a major source of bad user experience on the web today. However the CPU Long Task is depending on the computer/phones actual CPU speed, so you should measure this on the same type of the device that your user is using. To debug you should use the Chrome timeline log and drag/drop it into devtools or use Firefox Geckoprofiler. | ||
| Offenders: | ||
| Long cache headers is good (cacheHeadersLong) | The page has 7 requests that have a shorter cache time than 30 days (but still a cache time). | 93 |
| Description: Setting a cache header is good. Setting a long cache header (at least 30 days) is even better beacause then it will stay long in the browser cache. But what do you do if that asset change? Rename it and the browser will pick up the new version. | ||
| Offenders: | ||
Your best practice score is perfect!
| Title | Advice | Score |
|---|---|---|
| Use a good Content-Security-Policy header to make sure you you avoid Cross Site Scripting (XSS) attacks. (contentSecurityPolicyHeader) | Set a Content-Security-Policy header to make sure you are not open for Cross Site Scripting (XSS) attacks. You can start with setting a Content-Security-Policy-Report-Only header, that will only report the violation, not stop the download. | 0 |
| Description: Content Security Policy is delivered via a HTTP response header, and defines approved sources of content that the browser may load. It can be an effective countermeasure to Cross Site Scripting (XSS) attacks and is also widely supported and usually easily deployed. https://scotthelme.co.uk/content-security-policy-an-introduction/. | ||
| Offenders: | ||
| Set a referrer-policy header to make sure you do not leak user information. (referrerPolicyHeader) | Set a referrer-policy header to make sure you do not leak user information. | 0 |
| Description: Referrer Policy is a new header that allows a site to control how much information the browser includes with navigations away from a document and should be set by all sites. https://scotthelme.co.uk/a-new-security-header-referrer-policy/. | ||
| Offenders: | ||
| Page info | |
|---|---|
| Title | Wikipedia |
| Width | 360 |
| Height | 1996 |
| DOM elements | 1098 |
| Avg DOM depth | 9 |
| Max DOM depth | 12 |
| Iframes | 0 |
| Script tags | 4 |
| Local storage | 94 B |
| Session storage | 0 b |
| Network Information API | 4g |
| Resource Hints |
|---|
| preconnect |
| https://upload.wikimedia.org/ |
| https://en.wikipedia.org/ |
Data collected using Wappalyzer version 6.10.54. With updated code from Webappanalyzer 2024-12-27. Use --browsertime.firefox.includeResponseBodies htmlor --browsertime.chrome.includeResponseBodies htmlto help Wappalyzer find more information about technologies used.
| Technology | Confidence | Category |
|---|---|---|
| HSTS | 100 | Security |
Data from run 3
| Visual Metrics | |
|---|---|
| First Visual Change | 1.334 s |
| Speed Index | 3.485 s |
| Heading | 3.000 s |
| LargestContentfulPaint | 3.667 s |
| Last Meaningful Paint | 3.667 s |
| Largest Contentful Paint | 3.667 s |
| Visual Complete 85% | 3.167 s |
| Visual Complete 95% | 7.067 s |
| Visual Complete 99% | 13.367 s |
| Last Visual Change | 13.500 s |
| Visual Readiness | 12.166 s |
| Navigation Timing | |
|---|---|
| backEndTime | 419 ms |
| domContentLoadedTime | 3.007 s |
| domInteractiveTime | 3.007 s |
| domainLookupTime | 88 ms |
| frontEndTime | 2.659 s |
| pageDownloadTime | 92 ms |
| pageLoadTime | 3.170 s |
| redirectionTime | 0 ms |
| serverConnectionTime | 201 ms |
| serverResponseTime | 217 ms |
| Google Web Vitals | |
|---|---|
| Time to first byte (TTFB) | 419 ms |
| First Contentful Paint (FCP) | 1.316 s |
| Largest Contentful Paint (LCP) | 3.220 s |
| Cumulative Layout Shift (CLS) | 0.00 |
| Interaction to next paint (INP) | 760 ms |
| Total Blocking Time (TBT) | 146 ms |
| First Contentful Paint info | |
|---|---|
| Elements that needed recalculate style before FCP | 1391 |
| Time spent in recalculate style before FCP | 172.356 ms |
| Extra timings | |
|---|---|
| TTFB | 419 ms |
| First Paint | 1.316 s |
| Load Event End | 3.170 s |
| Fully loaded | 3.285 s |
When in time the page main content is rendered (collected using the Largest Contentful Paint API). Read more about Largest Contentful Paint.
| Element type | VIDEO |
| Element/tag | <video id="wikipedia25-video" class="wikipedia25-video" data-idle-light="portal/wikipedia.org/assets/img/wikipedia25-synthesizer-idle-light.webm" data-idle-dark="portal/wikipedia.org/assets/img/wikipedia25-synthesizer-idle-dark.webm" data-click-light="portal/wikipedia.org/assets/img/wikipedia25-synthesizer-click-light.webm" data-click-dark="portal/wikipedia.org/assets/img/wikipedia25-synthesizer-click-dark.webm" data-poster-light="portal/wikipedia.org/assets/img/wikipedia25-synthesizer-poster-light.webp" data-poster-dark="portal/wikipedia.org/assets/img/wikipedia25-synthesizer-poster-dark.webp" width="200" height="200" autoplay="" loop="" muted="" playsinline="" poster="portal/wikipedia.org/assets/img/wikipedia25-synthesizer-poster-light.webp" src="portal/wikipedia.org/assets/img/wikipedia25-synthesizer-idle-light.webm"></video> |
| Render time | 3.220 s |
| Element render delay | 190 ms |
| TTFB | 419 ms |
| Resource delay | 2.497 s |
| Resource load duration | 114 ms |
| Elements that needed recalculate style before LCP | 2077 |
| Time spent in recalculate style before LCP | 266.879 ms |
| Element id | wikipedia25-video |
| Load time | 3.064 s |
| URL | https://www.wikipedi...poster-light.webp |
| Size (width*height) | 10000 |
| DOM path | |
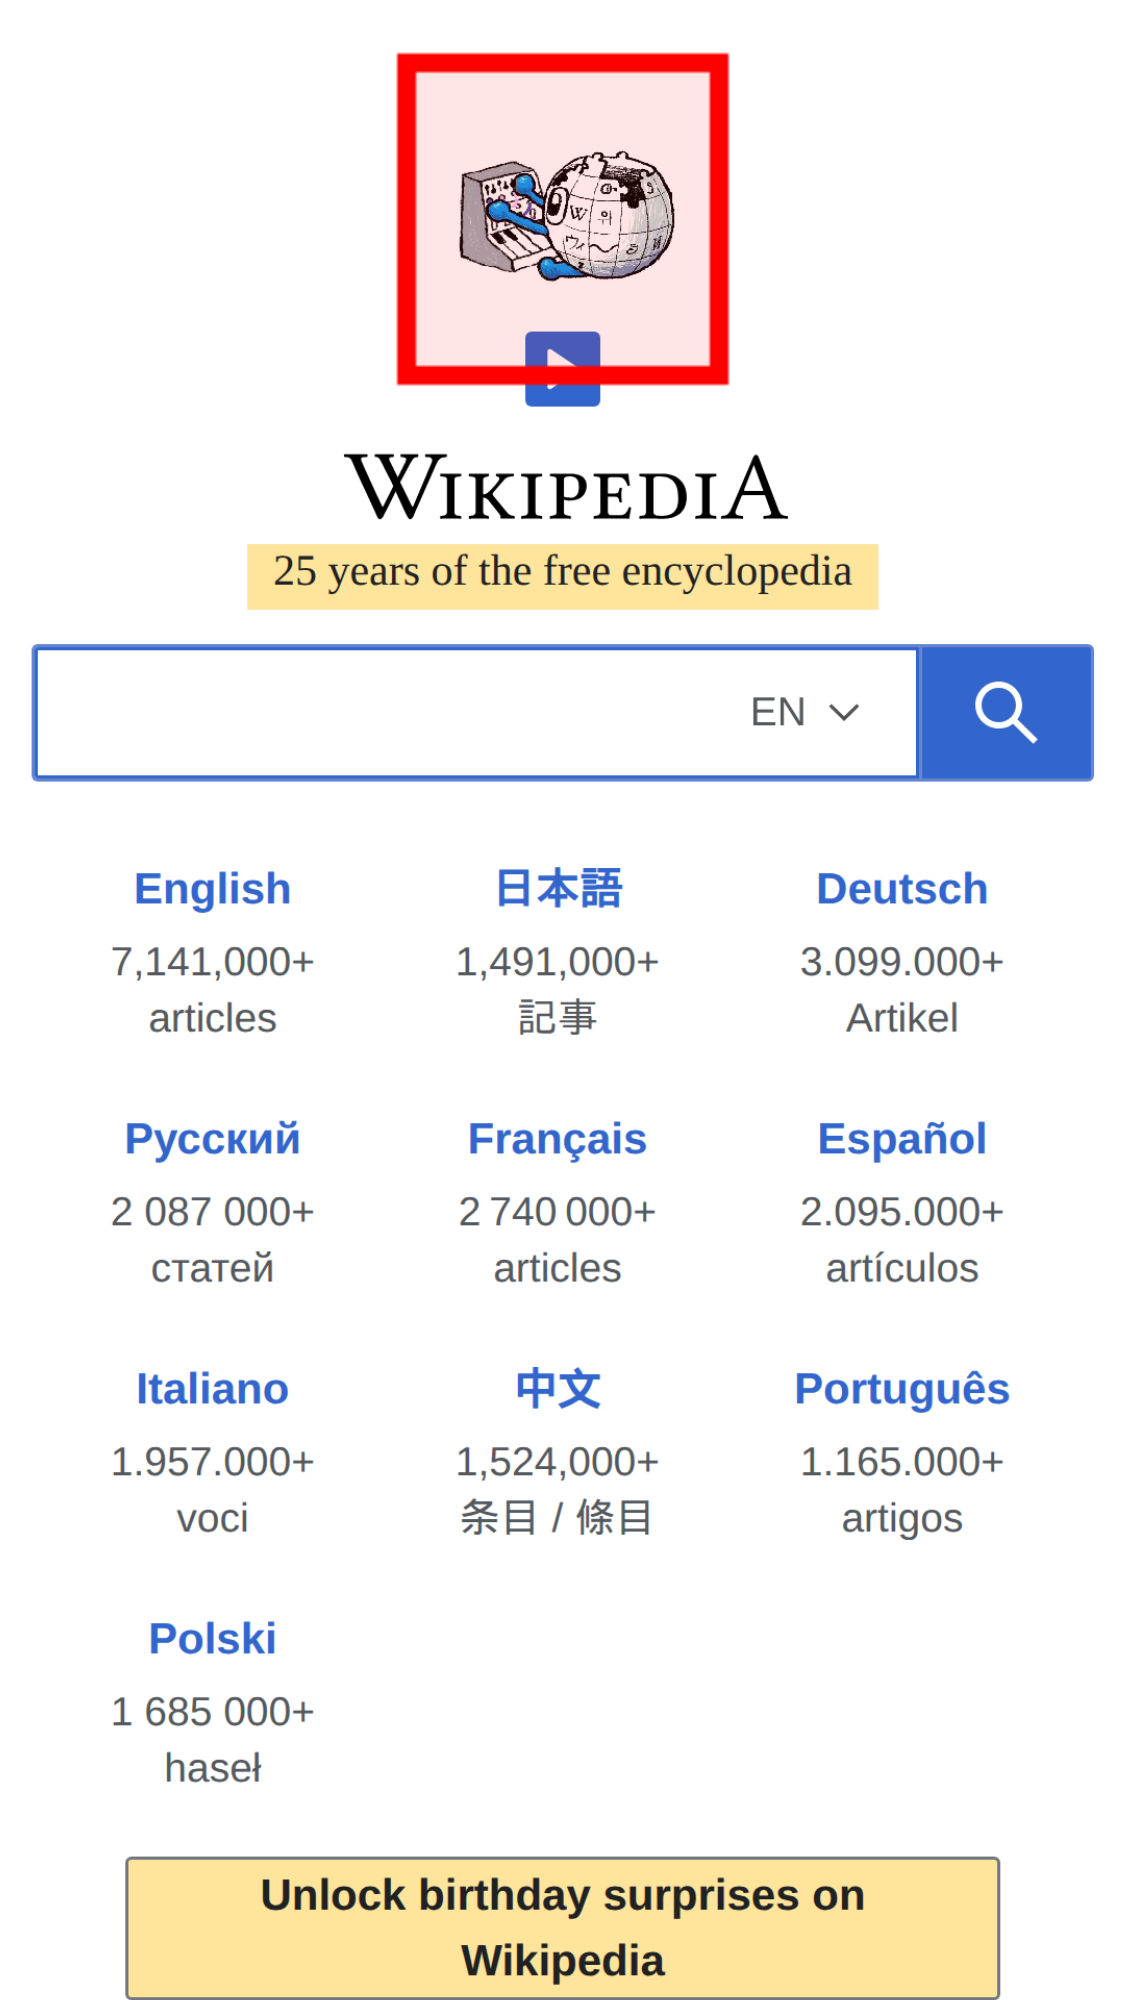
The largest contentful paint is highlighted in the image. If no element is highlighted the element was removed before the screenshot or the LCP API couldn't find the element.
The Largest Contentful Paint API highlighted this image as a part of the LCP.

0.00069 cumulative layout shift collected from the Cumulative Layout Shift API.
These HTML elements contribute most to the Cumulative Layout Shifts of the page. The higher score, the more layout shift.
| Score | HTML Element |
|---|---|
| 0.00069 | <div class=" styled-select js-enabled"></div> |
| body#www-wikipedia-org > main > div:eq(4) > form#search-form > fieldset > div#search-input > div:eq(0) | |
The elements that have shifted place is highlighted in the image (that have a higher value than 0.01). If the element shifted outside of the viewport, you will not see it there. It can be hard to understand what content that has shifted, if that's the case, checkout the video or the filmstrip of the run.
Interaction to Next Paint (INP) is a metric that try to measure responsiveness. It's useful if you are testing user journeys. Read more about Interaction to Next Paint.
The measured latency was 760 ms.
| Event type | pointerover |
| Element type | HTML |
| Element class name | js-enabled wikipedia25-birthday-mode-enabled |
| Event target | html.js-enabled.wikipedia25-birthday-mode-enabled |
| Load state when the event happened | loading |
Read more about the Long Animation Frames API here here.
The top 10 longest animation frames entries
| Blocking duration | Work duration | Render duration | PreLayout Duration | Style And Layout Duration |
|---|---|---|---|---|
| 1.275 s | 1.331 s | 7.4 ms | 6 ms | 1.4 ms |
| No availible script information. | ||||
| Blocking duration | Work duration | Render duration | PreLayout Duration | Style And Layout Duration |
|---|---|---|---|---|
| 401.6 ms | 59.7 ms | 409.6 ms | 409.5 ms | 0.1 ms |
| No availible script information. | ||||
| Blocking duration | Work duration | Render duration | PreLayout Duration | Style And Layout Duration |
|---|---|---|---|---|
| 178 ms | 16.7 ms | 212.8 ms | 0 ms | 212.8 ms |
| No availible script information. | ||||
| Blocking duration | Work duration | Render duration | PreLayout Duration | Style And Layout Duration |
|---|---|---|---|---|
| 129.4 ms | 202.8 ms | 5 ms | 4.1 ms | 0.9 ms |
| No availible script information. | ||||
| Blocking duration | Work duration | Render duration | PreLayout Duration | Style And Layout Duration |
|---|---|---|---|---|
| 4.3 ms | 63.8 ms | 2.1 ms | 2 ms | 0.1 ms |
| No availible script information. | ||||
| Blocking duration | Work duration | Render duration | PreLayout Duration | Style And Layout Duration |
|---|---|---|---|---|
| 0 ms | 77.1 ms | 1.2 ms | 0.9 ms | 0.3 ms |
| https://www.wikipedia.org/ | ||||
Invoker: https://www.wikipedia.org/ | ||||
| Blocking duration | Work duration | Render duration | PreLayout Duration | Style And Layout Duration |
|---|---|---|---|---|
| 0 ms | 75.1 ms | 4.7 ms | 4.7 ms | 0 ms |
| https://www.wikipedia.org/portal/wikipedia.org/assets/js/index-90de98612a.js | ||||
Invoker: https://www.wikipedia.org/portal/wikipedia.org/assets/js/index-90de98612a.js | ||||
| name | duration | description |
|---|---|---|
| cache | 0 | hit-front |
| host | 0 | cp3070 |
There are no custom configured scripts.
There are no custom extra metrics from scripting.
| Name | Display Time | X | Y | Width | Height |
|---|---|---|---|---|---|
| Heading | 3.000 s | 79 | 140 | 201 | 60 |
| <h1 class="central-textlogo-wrapper"></h1> | |||||
| LargestContentfulPaint (wikipedia25-synthesizer-idle-light.webm) | 3.667 s | 130 | 20 | 100 | 100 |
| <video id="wikipedia25-video" class="wikipedia25-video" data-idle-light="portal/wikipedia.org/assets/img/wikipedia25-synthesizer-idle-light.webm" data-idle-dark="portal/wikipedia.org/assets/img/wikipedia25-synthesizer-idle-dark.webm" data-click-light="portal/wikipedia.org/assets/img/wikipedia25-synthesizer-click-light.webm" data-click-dark="portal/wikipedia.org/assets/img/wikipedia25-synthesizer-click-dark.webm" data-poster-light="portal/wikipedia.org/assets/img/wikipedia25-synthesizer-poster-light.webp" data-poster-dark="portal/wikipedia.org/assets/img/wikipedia25-synthesizer-poster-dark.webp" width="200" height="200" autoplay="" loop="" muted="" playsinline="" poster="portal/wikipedia.org/assets/img/wikipedia25-synthesizer-poster-light.webp" src="portal/wikipedia.org/assets/img/wikipedia25-synthesizer-idle-light.webm"></video> | |||||
How the page is built.
| Summary | |
|---|---|
| HTTP version | HTTP/2.0 |
| Total requests | 9 |
| Total domains | 1 |
| Total transfer size | 276.3 KB |
| Total content size | 420.5 KB |
| Responses missing compression | 3 |
| Number of cookies | 3 |
| Third party cookies | 0 |
| Requests per response code | |
|---|---|
| 200 | 9 |
| URL | Type | Transfer Size | Content Size |
|---|---|---|---|
| https://www.wikipedi...r-idle-light.webm | video | 159.1 KB | 158.2 KB |
| https://www.wikipedi...ia-logo-v2@2x.png | image | 37.6 KB | 36.6 KB |
| https://www.wikipedia.org/ | html | 27.8 KB | 126.9 KB |
| https://www.wikipedi...rite-e49fbf32.svg | svg | 18.8 KB | 50.0 KB |
| https://www.wikipedi...poster-light.webp | image | 16.3 KB | 15.6 KB |
| https://www.wikipedi...dex-90de98612a.js | javascript | 9.5 KB | 26.6 KB |
| https://www.wikipedi...ogo_sister@2x.png | image | 4.1 KB | 3.3 KB |
| https://www.wikipedi...con/wikipedia.ico | favicon | 1.8 KB | 2.7 KB |
| https://www.wikipedi...ie9-507b16b6be.js | javascript | 1.3 KB | 580 B |
| Content | Header Size | Transfer Size | Content Size | Requests |
|---|---|---|---|---|
| html | 0 b | 27.8 KB | 126.9 KB | 1 |
| javascript | 0 b | 10.9 KB | 27.2 KB | 2 |
| image | 0 b | 58.0 KB | 55.5 KB | 3 |
| svg | 0 b | 18.8 KB | 50.0 KB | 1 |
| video | 0 b | 159.1 KB | 158.2 KB | 1 |
| favicon | 0 b | 1.8 KB | 2.7 KB | 1 |
| Total | 0 b | 276.3 KB | 420.5 KB | 9 |
| Domain | Total download time | Transfer Size | Content Size | Requests |
|---|---|---|---|---|
| www.wikipedia.org | 1.711 s | 276.3 KB | 420.5 KB | 9 |
| type | min | median | max |
|---|---|---|---|
| Expires | 1 hour | 1 day | 1 year |
| Last modified | 19 hours | 5 weeks | 21 weeks |
Included requests done after load event end.
| Content | Transfer Size | Requests |
|---|---|---|
| html | 0 b | 0 |
| css | 0 b | 0 |
| javascript | 0 b | 0 |
| image | 0 b | 0 |
| font | 0 b | 0 |
| favicon | 1.8 KB | 1 |
| Total | 1.8 KB | 1 |
Includes requests done after DOM content loaded.
| Content | Transfer Size | Requests |
|---|---|---|
| html | 0 b | 0 |
| css | 0 b | 0 |
| javascript | 0 b | 0 |
| image | 0 b | 0 |
| font | 0 b | 0 |
| favicon | 1.8 KB | 1 |
| Total | 1.8 KB | 1 |
Render blocking information directly from Chrome.
| Blocking | In body parser blocking | Potentially blocking |
|---|---|---|
| 1 | 1 | 0 |
| URL | Type |
|---|---|
| https://www.wikipedi...dex-90de98612a.js | blocking |
| https://www.wikipedi...ie9-507b16b6be.js | in_body_parser_blocking |
Download the Chrome trace log and drag and drop it into Developer Tools / Performance in Chrome.
Collected using the Long Task API. A long task is a task that take 50 milliseconds or more.
| Type | Quantity | Total duration (ms) |
|---|---|---|
| Total Blocking Time | 146 | |
| Max Potential First Input Delay | 194 | |
| Long Tasks before First Paint | 3 | 1988 |
| Long Tasks before First Contentful Paint | 3 | 1988 |
| Long Tasks before Largest Contentful Paint | 5 | 2234 |
| Long Tasks after Load Event End | 0 | 0 |
| Total Long Tasks | 5 | 2234 |
CPU last long task happened at 3.006 s
| name | startTime | duration | containerId | containerName | containerSrc | containerType |
|---|---|---|---|---|---|---|
| unknown | 575 | 219 | window | |||
| unknown | 860 | 435 | window | |||
| unknown | 1308 | 1334 | window | |||
| unknown | 2671 | 194 | window | |||
| self | 3006 | 52 | window |
Calculated using Tracium.
| Categories (ms) | |
|---|---|
| parseHTML | 70 |
| styleLayout | 2226 |
| paintCompositeRender | 89 |
| scriptParseCompile | 3 |
| scriptEvaluation | 100 |
| garbageCollection | 15 |
| other | 608 |
| Events (ms) | |
|---|---|
| Layout | 1958 |
| RunTask | 382 |
| UpdateLayoutTree | 267 |
| CpuProfiler::StartProfiling | 84 |
| ParseHTML | 67 |
| Paint | 67 |
| v8.run | 36 |
| PrePaint | 32 |
| EventDispatch | 24 |
| DecodedDataDocumentParser::AppendBytes | 23 |
| Commit | 20 |
| Layerize | 17 |
| RunMicrotasks | 17 |
| FunctionCall | 17 |
| DocumentLoader::BodyLoadingFinished | 13 |
| PaintImage | 11 |
| URL | CPU time (ms) |
|---|---|
| https://www.wikipedia.org/portal/wikipedia.org/assets/js/index-90de98612a.js | 63 |
| https://www.wikipedia.org/ | 10 |