Tested 2026-07-27 23:06:52 using Chrome 150.0.7871.186 (script).(runtime settings)
Test as a logged in userLogin the user with an empty browser cache, then visit Obama and Facebook
This page is fast to paint, snappy to interact with and visually stable, but loose on best practices, weak on user privacy and slow to respond from the server.

Visual metrics
Google Web Vitals
The page has 5 images (out of 5) without a decoding hint. Add decoding="async" to non-critical images so the browser can decode them off the main thread.
The main document gets redirected 3 time(s). Remove those redirect and make the page faster!
The total JavaScript transfer size is 299.6 kB and the uncompressed size is 1.3 MB. This is totally crazy! There is really room for improvement here.
Timings summary
| Metric | Min | Median | Mean | Max |
|---|---|---|---|---|
| First visual change | 2.000 s | 2.000 s | 2.000 s | 2.000 s |
| Last visual change | 2.466 s | 2.466 s | 2.466 s | 2.466 s |
| Speed index | 2.012 s | 2.012 s | 2.012 s | 2.012 s |
| Largest image | 2.000 s | 2.000 s | 2.000 s | 2.000 s |
| Heading | 2.000 s | 2.000 s | 2.000 s | 2.000 s |
| Largest contentful paint | 2.000 s | 2.000 s | 2.000 s | 2.000 s |
| Last meaningful paint | 2.000 s | 2.000 s | 2.000 s | 2.000 s |
| Visual readiness | 466 ms | 466 ms | 466 ms | 466 ms |
| Visual complete 85 | 2.000 s | 2.000 s | 2.000 s | 2.000 s |
| Visual complete 95 | 2.000 s | 2.000 s | 2.000 s | 2.000 s |
| Visual complete 99 | 2.466 s | 2.466 s | 2.466 s | 2.466 s |
Run 1 SpeedIndex median
Use --filmstrip.showAll to show all filmstrips.
Click a frame to seek the video to that moment. The dot marks frames where the page changed visually.
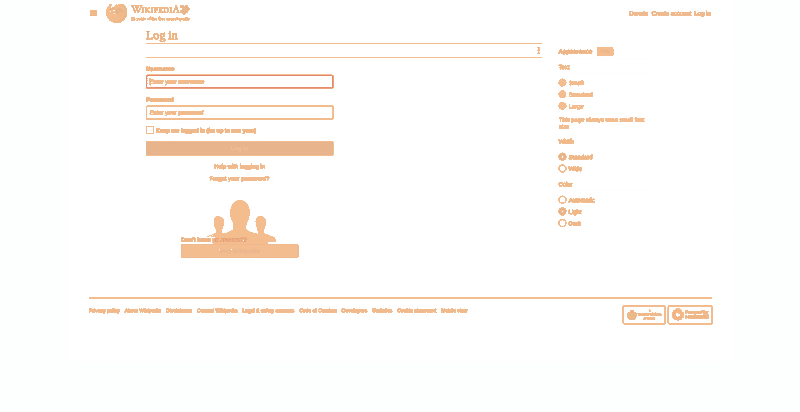
The whole recording in one image: every pixel is tinted by how often it changed. Amber changed once, deep red changed ten or more times. The scale is fixed, so heatmaps from different runs compare directly.
Flat amber is a page that painted once and stayed put. Red speckle in the shape of the text means the same pixels repainted over and over, usually invisible rendering noise that inflates Last Visual Change and Speed Index. A solid red block is a genuinely restless area, like an ad or a carousel.
How smoothly Chrome delivered frames to the screen during the test. Dropped counts only frames Chrome flags as affecting smoothness. On mostly-static pages the longest gap includes idle time where there was simply nothing to draw.
The server dominated the wait. The first byte took 1.585 s (79 % of the time to First Contentful Paint). Nothing can render before it arrives, and Google Web Vitals considers a TTFB over 800 ms in need of improvement. See the request timing on the Waterfall tab. First paint landed at 1.996 s; the 1 render-blocking request was done by 1.902 s.
Style the browser had to recalculate before it could paint: many elements or a lot of time spent here points at expensive CSS on the critical rendering path. The recalculation count and the largest single one tell the two problems apart: one massive style change touching most of the page (few recalculations, the largest close to the total) needs different medicine than thousands of tiny ones (many recalculations, each tiny).
Style recalculation is not holding up your paint. 16 ms of restyling before the page painted, 0.8 % of the time to First Contentful Paint. Nothing here needs attention.
The recalculation work before first paint is 0.8 % of the time to First Contentful Paint.
Blocking requests delay both paints: the browser renders nothing until they arrive, so they push First Contentful Paint and everything after it, including the largest paint (LCP). Requests that block the parser inside the body stall everything after them in the document. Load JavaScript with defer or async, and keep non-critical CSS off the critical path with media attributes. Bars show when each request loaded on a clock that runs to the last paint (the dashed line is FCP, the clock ends at LCP); the gap after the bars is style and layout work.
| Request | When it loaded | Transfer | Download |
|---|---|---|---|
document | 488 ms | 1.7 KB | 487 ms |
301 ms | 33.4 KB | 301 ms | |
startuppotentially blocking | 324 ms | 20.8 KB | 324 ms |
LCP resource | 101 ms | 2.7 KB | 101 ms |
0524 ms1.048 sFCP 1.996 sFCP · LCP 2.096 s |
How long Chrome spent testing each CSS selector against the page while recalculating styles. A selector with many match attempts and zero matches is evaluated against the document over and over for rules that never apply.
Not worth optimizing on this page. All selector matching cost 3 ms, and the worst single selector 0.15 ms. The tables are kept for reference.
| Selector | Time | Attempts | Matches |
|---|---|---|---|
:root | 0.15 ms | 10 | 6 |
.cdx-button | 0.08 ms | 66 | 66 |
.cdx-message__content > :first-child | 0.07 ms | 1 446 | 0 |
.cdx-message__content > * | 0.06 ms | 1 446 | 0 |
.cdx-message__content > :last-child | 0.05 ms | 1 446 | 0 |
.mw-body | 0.04 ms | 2 | 2 |
.vector-icon | 0.04 ms | 18 | 18 |
.ve-not-available a:has(+ .mw-editsection-divider + a.mw-editsection-visualeditor:last-of-type)::after | 0.04 ms | 88 | 0 |
a:where(:not([role="button"])):visited | 0.04 ms | 176 | 88 |
.cdx-text-input__input | 0.03 ms | 12 | 12 |
| Selector | Attempts | Time |
|---|---|---|
.cdx-message__content > :first-child | 1 446 | 0.07 ms |
.cdx-message__content > :last-child | 1 446 | 0.05 ms |
.cdx-message__content > * | 1 446 | 0.06 ms |
.mw-body blockquote > :first-child | 482 | 0.02 ms |
.mw-body blockquote > :last-child | 482 | 0.02 ms |
.center * | 482 | 0.03 ms |
figure[typeof~="mw:File/Thumb"] > :not(figcaption) | 482 | 0.03 ms |
figure[typeof~="mw:File/Frame"] > :not(figcaption) | 482 | 0.01 ms |
.oo-ui-actionFieldLayout .oo-ui-actionFieldLayout-input > .oo-ui-textInputWidget > .oo-ui-inputWidget-input:hover ~ * | 192 | 0.01 ms |
.oo-ui-actionFieldLayout .oo-ui-actionFieldLayout-input > .oo-ui-textInputWidget.oo-ui-flaggedElement-invalid > .oo-ui-inputWidget-input ~ * | 192 | 0.00 ms |
Why the browser had to recalculate style and layout: every DOM/style change invalidates some set of nodes, and the same class or attribute churning over and over is the pattern to hunt. Counts, not milliseconds: the time is in the style recalculation numbers above.
Chase what keeps changing after the page is up. 132 style recalculations and 204 layout invalidations fired after first paint, on a page the user was already looking at. The biggest driver is attribute title (10×). Start with the script under "Scripts causing invalidations" that keeps triggering it.
attribute: title10×attribute: class9×attribute: href8×pseudo: visited7×pseudo: disabled2×pseudo: enabled2×attribute: disabled1×class: vector-animations-ready1×class: ve-not-available1×Invalidations while the largest paint was still pending, so these delayed it.
| Reason | Style recalculations | Layout |
|---|---|---|
| A node was inserted into the page | 4 | – |
| Control | 14 | – |
| An animation updated stylesAnimate transform and opacity so the compositor can run it off the main thread. | 14 | – |
| An element entered layout | – | 48 |
Churn on the fully rendered page: wasted work and possible jank, but no paint delay.
| Reason | Style recalculations | Layout |
|---|---|---|
| Related style rule | 72 | – |
| A node was inserted into the page | 11 | – |
| A stylesheet rule changed | 12 | – |
| An @keyframes rule changed | 5 | – |
| An element entered layout | – | 105 |
| An SVG element changed | – | 42 |
| An element's size changed | – | 4 |
| Unknown | – | 4 |
| A style change forced layout | – | 1 |
The page being constructed and styled for the first render. Expected work, shown for scale.
| Reason | Style recalculations | Layout |
|---|---|---|
| A node was inserted into the page | 12 | – |
| Control | 4 | – |
| An animation updated stylesAnimate transform and opacity so the compositor can run it off the main thread. | 2 | – |
| A stylesheet rule changed | 1 | – |
| A pseudo-class state changed (:hover, :focus, …) | 2 | – |
| JavaScript changed an inline styleSet a class instead of writing element.style, so the browser can batch the work. | 1 | – |
| An element entered layout | – | 460 |
| An SVG element changed | – | 132 |
| An element's size changed | – | 3 |
| Unknown | – | 3 |
| Scrollbar changed | – | 3 |
| An element left layout | – | 2 |
| A style change forced layout | – | 1 |
mediawiki.utilinvalidations · all after first paintjqueryinvalidations · all after first paintext.wikimediaEventsinvalidations · all after first paintskins.vector.jsinvalidations · all after first paintskins.vector.clientPreferencesinvalidations · all after first paintmediawiki.page.readyinvalidations · all after first paint5 animations run on the main thread instead of on the browser's fast path that animates without blocking other page work (the compositor); they can make the rendering you see above janky. See them on the CPU tab.
The coach helps you find performance problems on your web page using web performance best practice rules. And gives you advice on privacy and best practices. Tested using Coach-core version 9.2.1.
decodingAsyncThe page has 5 images (out of 5) without a decoding hint. Add decoding="async" to non-critical images so the browser can decode them off the main thread.
Setting decoding="async" on an <img> tells the browser it can decode the image off the main thread, which keeps the page responsive to user interactions while images are being processed. The default ("auto") leaves the choice to the browser. https://developer.mozilla.org/en-US/docs/Web/HTML/Element/img#decoding
documentRedirectThe main document gets redirected 3 time(s). Remove those redirect and make the page faster!
You should never ever redirect the main document, because it will make the page load slower for the user. Well, you should redirect the user if the user tries to use HTTP and there's an HTTPS version of the page. The coach checks for that. :)
javascriptSizeThe total JavaScript transfer size is 299.6 kB and the uncompressed size is 1.3 MB. This is totally crazy! There is really room for improvement here.
A lot of JavaScript often means you are downloading more than you need. How complex is the page and what can the user do on the page? Do you use multiple JavaScript frameworks?
| URL | Transfer | Content |
|---|---|---|
| https://en.wikipedia.org/w/load.php...ia.org/w/load.php | 20.8 KB | 62.3 KB |
| https://en.wikipedia.org/w/load.php...ia.org/w/load.php | 18.1 KB | 60.5 KB |
| https://en.wikipedia.org/w/load.php...ia.org/w/load.php | 253.7 KB | 1.1 MB |
firstContentfulPaintFirst contentful paint can be improved (1.996 s). It is in the Google Web Vitals needs improvement range, slower than 1.8 seconds.
The First Contentful Paint (FCP) metric measures the time from when the page starts loading to when any part of the page content is rendered on the screen. For this metric, "content" refers to text, images (including background images), <svg> elements, or non-white <canvas> elements.
avoidScalingImagesThe page has 4 images that are scaled more than 100 pixels. It would be better if those images are sent so the browser don't need to scale them.
It's easy to scale images in the browser and make sure they look good in different devices, however that is bad for performance! Scaling images in the browser takes extra CPU time and will hurt performance on mobile. And the user will download extra kilobytes (sometimes megabytes) of data that could be avoided. Don't do that, make sure you create multiple version of the same image server-side and serve the appropriate one.
cacheHeadersThe page has 3 requests that are missing a cache time. Configure a cache time so the browser doesn't need to download them every time. It will save NaN undefined the next access.
The easiest way to make your page fast is to avoid doing requests to the server. Setting a cache header on your server response will tell the browser that it doesn't need to download the asset again during the configured cache time! Always try to set a cache time if the content doesn't change for every request.
assetsRedirectsThe page has 2 redirects. 1 of the redirects are from the base domain, please fix them! 1 request are from other domains, it could be 3rd-party assets doing unnecessary redirects. :(
A redirect is one extra step for the user to download the asset. Avoid that if you want to be fast. Redirects are even more of a showstopper on mobile.
privateAssetsThe page has 3 requests with private headers. The main page has a private header. It could be right in some cases where the user can be logged in and served specific content. But if your asset is static it should never be private. Make sure that the assets really should be private and only used by one user. Otherwise, make it cacheable for everyone.
If you set private headers on content, that means that the content are specific for that user. Static content should be able to be cached and used by everyone. Avoid setting the cache header to private.
spofThe page has 1 request inside of the head that can cause a SPOF (single point of failure). Load them asynchronously or move them outside of the document head.
A page can be stopped from loading in the browser if a single JavaScript, CSS, and in some cases a font, couldn't be fetched or is loading really slowly (the white screen of death). That is a scenario you really want to avoid. Never load 3rd-party components synchronously inside of the head tag.
compressAssetsThe page has 1 request that are served uncompressed. You could save a lot of bytes by sending them compressed instead.
In the early days of the Internet there were browsers that didn't support compressing (gzipping) text content. They do now. Make sure you compress HTML, JSON, JavaScript, CSS and SVG. It will save bytes for the user; making the page load faster and use less bandwith.
| URL | Transfer | Content |
|---|---|---|
| https://auth.wikimedia.org/enwiki/wiki/Special:UserLogin...Special:UserLogin | 14.1 KB | 39.0 KB |
optimalCssSizehttps://en.wikipedia.org/w/load.php?lang=en&modules=ext.uls.interlanguage%7Cext.visualEditor.desktopArticleTarget.noscript%7Cext.webauthn.passwordlessLogin.styles%7Cmediawiki.codex.messagebox.styles%7Cmediawiki.htmlform.codex.styles%7Cmediawiki.htmlform.styles%7Cmediawiki.special.userlogin.common.styles%7Cmediawiki.special.userlogin.login.styles%7Cskins.vector.icons%2Cstyles%7Cskins.vector.search.codex.styles&only=styles&skin=vector-2022 size is 34.2 kB (34209) and that is bigger than the limit of 25 kB. Try to keep each CSS response under 25 kB.
Render-blocking CSS holds up the first paint until it has fully downloaded, parsed and applied, so smaller CSS files mean a faster start. Split your CSS into a small critical bundle inlined or eagerly loaded, with the rest lazy-loaded.
| URL | Transfer | Content |
|---|---|---|
| https://en.wikipedia.org/w/load.php...ia.org/w/load.php | 33.4 KB | 303.7 KB |
cacheHeadersLongThe page has 6 requests that have a shorter cache time than one year (but still a cache time).
Setting a cache header is good. Setting a long cache header (a year) is even better because the asset will stay in the browser cache across visits. For content-hashed URLs (e.g. app.4af2.css) you can safely use Cache-Control: max-age=31536000, immutable. For unversioned URLs that may change, use a revalidating strategy instead.
inlineCssThe page has both inline CSS and CSS requests even though it uses a HTTP/2-ish connection. If you have many users on slow connections, it can be better to only inline the CSS. Run your own tests and check the waterfall graph to see what happens.
In the early days of the Internet, inlining CSS was one of the ugliest things you can do. That has changed if you want your page to start rendering fast for your user. Always inline the critical CSS when you use HTTP/1 and HTTP/2 (avoid doing CSS requests that block rendering) and lazy load and cache the rest of the CSS. It is a little more complicated when using HTTP/2. Does your server support HTTP push? Then maybe that can help. Do you have a lot of users on a slow connection and are serving large chunks of HTML? Then it could be better to use the inline technique, becasue some servers always prioritize HTML content over CSS so the user needs to download the HTML first, before the CSS is downloaded.
avoidRenderBlockingThe page has 1 blocking requests and 0 in body parser blocking (0 JavaScript and 1 CSS). There are 1 potentially render blocking requests. You need to verify if it is render blocking: https://en.wikipedia.org/w/load.php?lang=en&modules=startup&only=scripts&raw=1&safemode=1&skin=vector-2022
The critical rendering path is what the browser needs to do to start rendering the page. Every file requested inside of the head element will postpone the rendering of the page, because the browser need to do the request. Avoid loading JavaScript synchronously inside of the head (you should not need JavaScript to render the page), request files from the same domain as the main document (to avoid DNS lookups) and inline CSS for really fast rendering and a short rendering path.
metaDescriptionThe page is missing a meta description.
Use a page description to make the page more relevant to search engines.
thirdPartyThe page do 50% requests to third party domains (9 requests and 340 kB). First party is 9 requests and 80.2 kB. The page transfer more bytes from third party domains (340 kB) then first party (80.2 kB). The regex .*wikimedia.* was used to calculate first/third party requests.
Do not load most of your content from third party URLs.
urlThe page is using more than two request parameters. You should really rethink and try to minimize the number of parameters. The URL is 158 characters long. Try to make it less than 100 characters.
A clean URL is good for the user and for SEO. Make them human readable, avoid too long URLs, spaces in the URL, too many request parameters, and never ever have the session id in your URL.
viewportThe viewport meta tag does not contain width=device-width, the browser may use a desktop-width fallback.
The viewport meta tag tells the browser how to lay out the page on small screens. Without it (or without width=device-width) the page is rendered at a desktop fallback width and scaled down, which makes text unreadable on mobile. Disabling zoom (user-scalable=no, maximum-scale<=1) is also an accessibility regression. https://developer.mozilla.org/en-US/docs/Web/HTML/Viewport_meta_tag
unnecessaryHeadersThere are 14 responses that sets both a max-age and expires header. There are 18 responses that sets a server header.
Do not send headers that you don't need. We look for p3p, cache-control and max-age, pragma, server and x-frame-options headers. Have a look at Andrew Betts - Headers for Hackers talk as a guide https://www.youtube.com/watch?v=k92ZbrY815c or read https://www.fastly.com/blog/headers-we-dont-want.
longHeadershttps://auth.wikimed...Special:UserLogin has a header set-cookie that is 616 characters long. https://en.wikipedia...ia.org/w/load.php has a header sourcemap that is 1099 characters long.
Do not send response headers that are too long.
contentSecurityPolicyHeaderSet a Content-Security-Policy header to mitigate cross-site scripting attacks. You can start with a Content-Security-Policy-Report-Only header, which only reports violations rather than blocking them.
A Content-Security-Policy response header tells the browser which sources of script, style, and other content are allowed. The most effective form is a strict CSP using nonces or hashes together with strict-dynamic; the worst is a missing header, with unsafe-inline and unsafe-eval close behind. https://web.dev/articles/strict-csp
crossOriginEmbedderPolicyHeaderSet a Cross-Origin-Embedder-Policy header (typically require-corp or credentialless) on the document response to control cross-origin embedding.
Cross-Origin-Embedder-Policy (COEP) makes the page refuse to load cross-origin subresources unless they explicitly opt in via CORP or CORS. Together with Cross-Origin-Opener-Policy it puts the page in a cross-origin isolated context, which mitigates cross-window side-channel attacks (Spectre) and unlocks high-resolution timers and SharedArrayBuffer. https://developer.mozilla.org/en-US/docs/Web/HTTP/Headers/Cross-Origin-Embedder-Policy
crossOriginOpenerPolicyHeaderSet a Cross-Origin-Opener-Policy header (typically same-origin) on the document response to isolate the page from cross-origin windows.
Cross-Origin-Opener-Policy (COOP) lets a page sever its window-group ties to cross-origin documents that opened it or that it opens. Together with Cross-Origin-Embedder-Policy it puts the page in a cross-origin isolated context, which mitigates cross-window side-channel attacks (Spectre) and unlocks high-resolution timers and SharedArrayBuffer. https://developer.mozilla.org/en-US/docs/Web/HTTP/Headers/Cross-Origin-Opener-Policy
crossOriginResourcePolicyHeaderSet a Cross-Origin-Resource-Policy header (same-origin, same-site or cross-origin) on the document response to limit who may embed it.
Cross-Origin-Resource-Policy (CORP) is a per-response opt-in that tells the browser which origins are allowed to embed the resource. It blocks cross-origin or cross-site no-cors embedding (img, script, iframe, etc.) and is one of the building blocks of cross-origin isolation. https://developer.mozilla.org/en-US/docs/Web/HTTP/Headers/Cross-Origin-Resource-Policy
permissionsPolicyHeaderSet a Permissions-Policy header to control which browser features the page can use.
The Permissions-Policy response header (the successor to Feature-Policy) lets a site explicitly opt in or out of powerful browser features such as camera, microphone, geolocation, payment and clipboard. Setting a strict policy reduces the attack surface and limits what embedded third parties can do. https://developer.mozilla.org/en-US/docs/Web/HTTP/Headers/Permissions-Policy
referrerPolicyHeaderSet a referrer-policy header to make sure you do not leak user information.
Referrer Policy is a new header that allows a site to control how much information the browser includes with navigations away from a document and should be set by all sites. https://scotthelme.co.uk/a-new-security-header-referrer-policy/.
thirdPartyCookiesThe page sets 8 third party cookies.
Third party cookies are used to track the user. They are automatically blocked in Safari and Firefox.
A snapshot of what the browser actually built for this page: the document, how big and deep the DOM tree is and what it kept in storage. Big, deep trees are slower to style and lay out, so the counts Chrome warns about carry a flag.
Document
What the page says it is and how large it rendered.
DOM structure
How much markup the browser has to build, style and lay out.
What the page stored on the client, and the network it was tested on.
Data collected using
Coach-core version 9.2.1. With updated code from
Webappanalyzer 2026-05-04. Use
--browsertime.firefox.includeResponseBodies html or
--browsertime.chrome.includeResponseBodies html to help Wappalyzer find more information about technologies used.
Data from run 1
0.0s2.0s2.1s2.2s2.4s2.5sWhen the page main content is rendered, collected via the Largest Contentful Paint API. Read more about Largest Contentful Paint.
body > div:eq(2) > div > div:eq(2) > main#content > div#bodyContent > div#mw-content-text > div:eq(1) > div#userloginForm > form > div:eq(7) > div > div#mw-createaccount-cta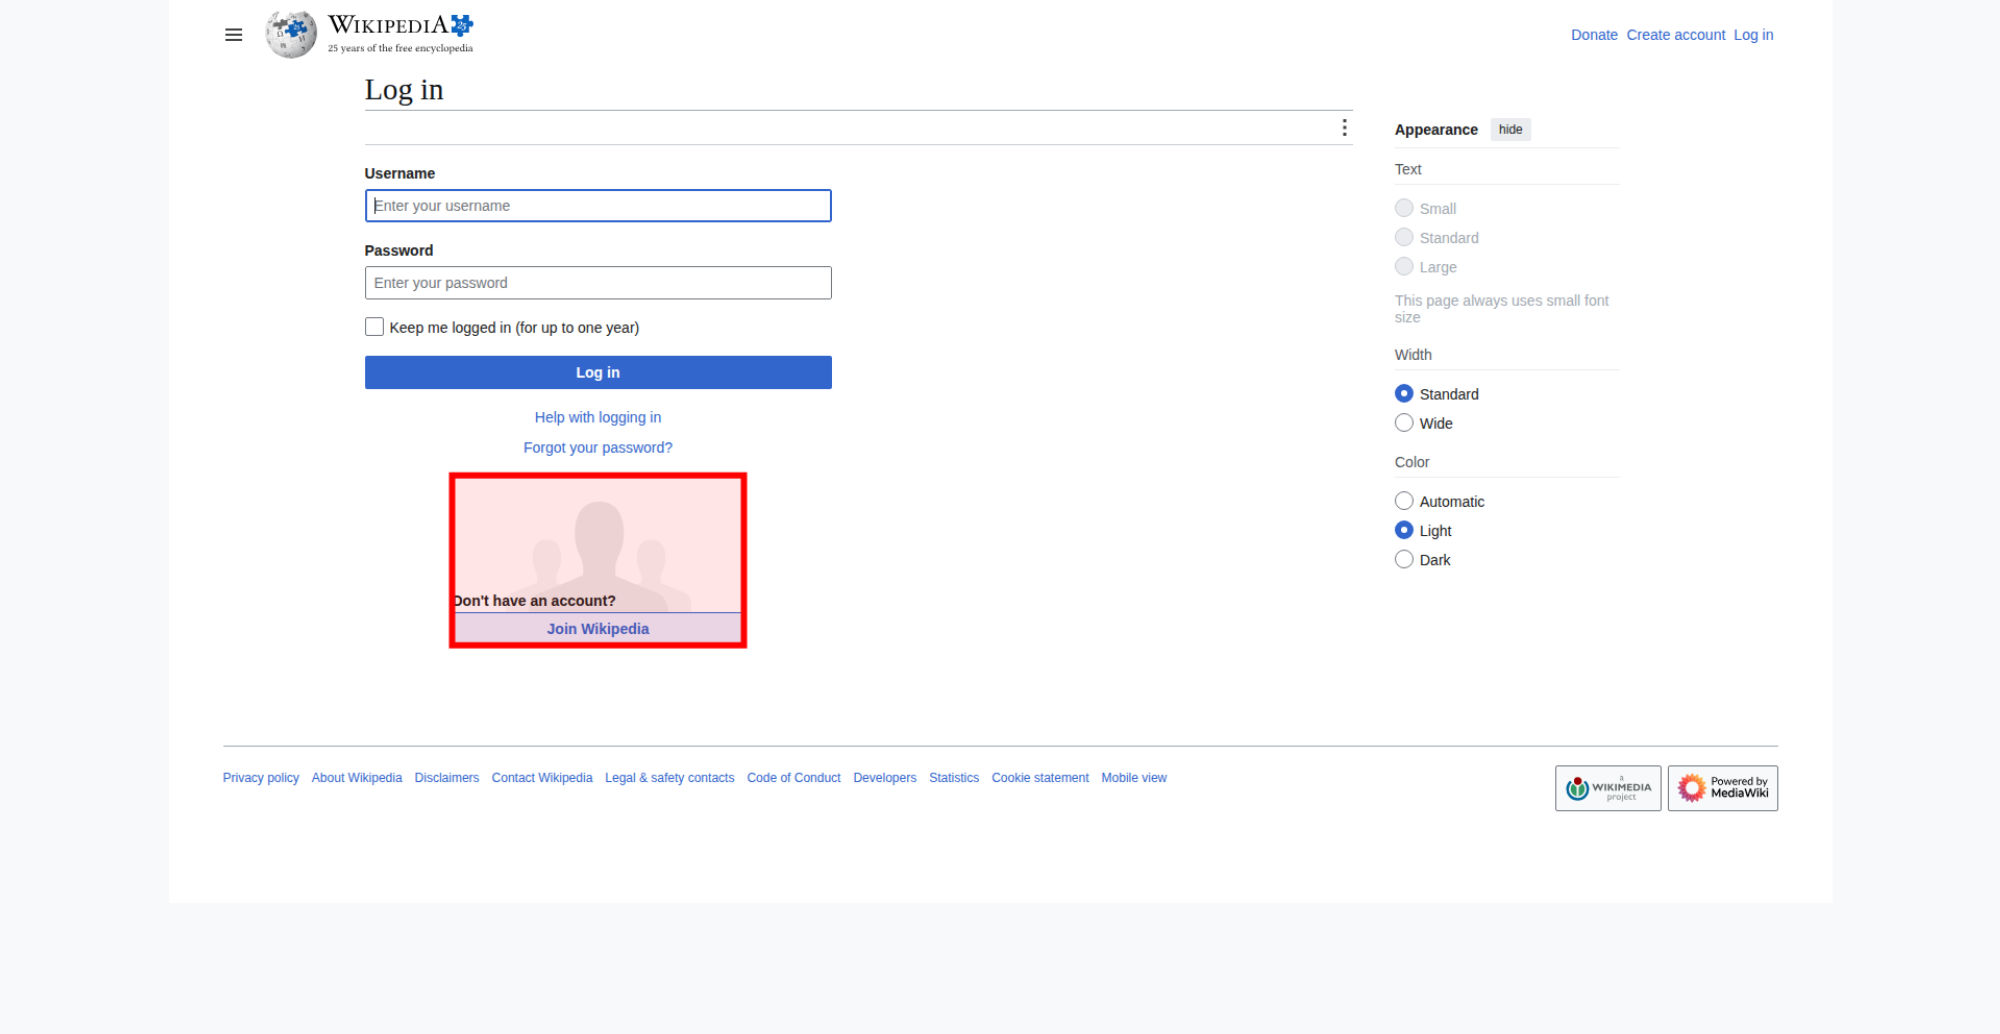
The LCP element is highlighted in the screenshot. If nothing is highlighted the element was removed before the screenshot or the LCP API couldn't find it.
The Largest Contentful Paint API matched this image:

How much the page's content shifts as it loads, collected via the Cumulative Layout Shift API.
No layout shifts were detected on this page.
Timing data the server chose to expose through Server-Timing response headers on the main document — typically backend time, cache status or experiment flags.
| Name | Duration | Description |
|---|---|---|
cache | 0 ms | pass |
host | 0 ms | cp3070 |
co_id | 0 ms | 2457372389 |
There are no custom configured scripts.
There are no custom extra metrics from scripting.

How the page is built.
| Header | Value |
|---|---|
age | 0 |
cache-control | private, s-maxage=0, max-age=0, must-revalidate, no-transform |
content-length | 0 |
content-type | text/html; charset=UTF-8 |
date | Mon, 27 Jul 2026 23:06:53 GMT |
expires | Thu, 01 Jan 1970 00:00:00 GMT |
location | https://auth.wikimedia.org/metawiki/wiki/Special:CentralAutoLogin/checkLoggedIn?useformat=desktop&type=redirect&returnUrlToken=e4e4d157644ae07bae904103a05e2e65&wikiid=enwiki&usesul3=1&useformat=desktop |
nel | { "report_to": "wm_nel", "max_age": 604800, "failure_fraction": 0.05, "success_fraction": 0.0} |
report-to | { "group": "wm_nel", "max_age": 604800, "endpoints": [{ "url": "https://intake-logging.wikimedia.org/v1/events?stream=w3c.reportingapi.network_error&schema_uri=/w3c/reportingapi/network_error/1.0.0" }] } |
server | mw-web.eqiad.main-5fc9744499-fpdpb |
server-timing | cache;desc="pass", host;desc="cp3070",co_id;desc="1963838229" |
strict-transport-security | max-age=106384710; includeSubDomains; preload |
vary | Accept-Encoding,X-Forwarded-Proto,Cookie,Authorization,User-Agent |
x-analytics | |
x-cache | cp3070 miss, cp3070 pass |
x-cache-status | pass |
x-client-ip | 138.201.135.103 |
x-content-type-options | nosniff |
x-request-id | 3f496791-11e4-41d0-a4e6-536fff73f241 |
Transfer size410.3 KB
Content size1.7 MB
Requests15
| Content | Header Size | Transfer Size | Content Size | Requests |
|---|---|---|---|---|
| html | 0 b | 14.1 KB | 39.0 KB | 1 |
| css | 0 b | 33.4 KB | 303.7 KB | 1 |
| javascript | 0 b | 292.6 KB | 1.3 MB | 3 |
| image | 0 b | 2.7 KB | 1.6 KB | 1 |
| favicon | 0 b | 1.8 KB | 2.7 KB | 1 |
| svg | 0 b | 64.8 KB | 155.6 KB | 7 |
| plain | 0 b | 905 B | 0 b | 1 |
| Total | 0 b | 410.3 KB | 1.7 MB | 15 |
| Domain | Total download time | Transfer Size | Content Size | Requests |
|---|---|---|---|---|
| en.wikipedia.org | 2.996 s | 332.0 KB | 1.6 MB | 9 |
| auth.wikimedia.org | 2.163 s | 78.3 KB | 196.8 KB | 9 |
| type | min | median | max |
|---|---|---|---|
| Expires | 0 seconds | 4 weeks | 1 year |
| Last modified | 4 days | 3 weeks | 3 weeks |
Includes requests done after load event end.
| Content | Transfer Size | Requests |
|---|---|---|
| html | 0 b | 0 |
| css | 0 b | 0 |
| javascript | 0 b | 0 |
| image | 0 b | 0 |
| font | 0 b | 0 |
| favicon | 1.8 KB | 1 |
| plain | 905 B | 1 |
| Total | 2.7 KB | 2 |
Includes requests done after DOM content loaded.
| Content | Transfer Size | Requests |
|---|---|---|
| html | 0 b | 0 |
| css | 0 b | 0 |
| javascript | 271.8 KB | 2 |
| image | 0 b | 0 |
| font | 0 b | 0 |
| favicon | 1.8 KB | 1 |
| plain | 905 B | 1 |
| Total | 274.5 KB | 4 |
JavaScript and CSS coverage from the extra profile run made by --enableProfileRun, not from the timed iterations. For JS, Chrome tracks which blocks of each script actually ran: a byte is unused when the innermost block of code around it never ran. For CSS, Chrome records every selector that no element on the page matched during the iteration. Enable with --chrome.coverage on every run, or --enableProfileRun to keep the main run's timing metrics untouched. Unused bytes still cost network, parse and compile time for no benefit. Expand the section below for the full picture.
sitespeed.io drives Chrome's V8 profiler and CSS rule tracker via the DevTools Protocol, the same machinery the DevTools Coverage panel uses. The two columns are populated by two different mechanisms.
Browsertime calls Profiler.startPreciseCoverage with detailed (block-level) mode at the start of the iteration and Profiler.takePreciseCoverage at the end. V8 returns nested ranges per function: an outer range covering the function body and inner ranges for sub-blocks (if/else, switch arms, ternaries). Each range has an execution count. A byte is "used" if the innermost range that covers it has count > 0, "unused" if it has count = 0, so we catch both functions that never ran AND dead branches inside functions that did.
Browsertime calls CSS.startRuleUsageTracking at the start of the iteration and CSS.stopRuleUsageTracking at the end. Chrome returns a flat list of rule-text ranges with a used flag: a rule is "used" if at least one element on the page matched it during the iteration. Both inline <style> blocks and external stylesheets are included.
Coverage reflects only what executed during this run. Code behind a button click stays unused unless the iteration clicked the button. The collection window opens before navigation and closes when measure.stop() is reached, so the only way to count interactions is to drive them between measure.start() and measure.stop() inside a navigation script (pass a .js file as the input instead of a plain URL). Clicks, form fills and waits placed there all count toward "used". --preScript runs before the URL is loaded so it can't interact with the page being measured, and --postScript runs after coverage has already been collected, so neither helps here. Detailed coverage also tells V8 to skip some optimisations, which drifts timing metrics like LCP and TBT; that's why --enableProfileRun is the safer option for production measurement (it collects coverage in a separate iteration that doesn't count towards the medians).
1.8 MB of script and style shipped, and 1.1 MB of it never ran on this page. The biggest win is load.php[scripts:ext.centralNotice.geoIP]: 1.1 MB delivered, 633.2 KB unused, and inside it oojs-ui-core alone ships 151.1 KB of dead code.
| URL | Total | Used | Unused | Unused % | ||||||||||||||||||||||||||||||||||||||||||||||||||||||||||||||||||||||||||||||||||||||||||||||||||||||||||||||||||||||||||||||||||||||||||||||||||||||||||||||||||||||||||||||||||||||||||||||||||||||||||||||||||||||||||||||||||||||||||||||||||||||||||||||||||||||||||||||||||||||||||||||||||||||||||||||||||||||||||||||||||||||||||||||||
|---|---|---|---|---|---|---|---|---|---|---|---|---|---|---|---|---|---|---|---|---|---|---|---|---|---|---|---|---|---|---|---|---|---|---|---|---|---|---|---|---|---|---|---|---|---|---|---|---|---|---|---|---|---|---|---|---|---|---|---|---|---|---|---|---|---|---|---|---|---|---|---|---|---|---|---|---|---|---|---|---|---|---|---|---|---|---|---|---|---|---|---|---|---|---|---|---|---|---|---|---|---|---|---|---|---|---|---|---|---|---|---|---|---|---|---|---|---|---|---|---|---|---|---|---|---|---|---|---|---|---|---|---|---|---|---|---|---|---|---|---|---|---|---|---|---|---|---|---|---|---|---|---|---|---|---|---|---|---|---|---|---|---|---|---|---|---|---|---|---|---|---|---|---|---|---|---|---|---|---|---|---|---|---|---|---|---|---|---|---|---|---|---|---|---|---|---|---|---|---|---|---|---|---|---|---|---|---|---|---|---|---|---|---|---|---|---|---|---|---|---|---|---|---|---|---|---|---|---|---|---|---|---|---|---|---|---|---|---|---|---|---|---|---|---|---|---|---|---|---|---|---|---|---|---|---|---|---|---|---|---|---|---|---|---|---|---|---|---|---|---|---|---|---|---|---|---|---|---|---|---|---|---|---|---|---|---|---|---|---|---|---|---|---|---|---|---|---|---|---|---|---|---|---|---|---|---|---|---|---|---|---|---|---|---|---|---|---|---|---|---|---|---|---|---|---|---|---|---|---|---|---|---|---|---|---|---|---|---|---|---|
| load.php[scripts:ext.centralNotice.geoIP] | 1.1 MB | 529.0 KB | 633.2 KB | |||||||||||||||||||||||||||||||||||||||||||||||||||||||||||||||||||||||||||||||||||||||||||||||||||||||||||||||||||||||||||||||||||||||||||||||||||||||||||||||||||||||||||||||||||||||||||||||||||||||||||||||||||||||||||||||||||||||||||||||||||||||||||||||||||||||||||||||||||||||||||||||||||||||||||||||||||||||||||||||||||||||||||||||||
55 modules in this bundle, by unused bytes
| ||||||||||||||||||||||||||||||||||||||||||||||||||||||||||||||||||||||||||||||||||||||||||||||||||||||||||||||||||||||||||||||||||||||||||||||||||||||||||||||||||||||||||||||||||||||||||||||||||||||||||||||||||||||||||||||||||||||||||||||||||||||||||||||||||||||||||||||||||||||||||||||||||||||||||||||||||||||||||||||||||||||||||||||||||||
| load.php[scripts:ext.visualEditor.core.utils.parsing] | 60.5 KB | 14.0 KB | 46.5 KB | |||||||||||||||||||||||||||||||||||||||||||||||||||||||||||||||||||||||||||||||||||||||||||||||||||||||||||||||||||||||||||||||||||||||||||||||||||||||||||||||||||||||||||||||||||||||||||||||||||||||||||||||||||||||||||||||||||||||||||||||||||||||||||||||||||||||||||||||||||||||||||||||||||||||||||||||||||||||||||||||||||||||||||||||||
8 modules in this bundle, by unused bytes
| ||||||||||||||||||||||||||||||||||||||||||||||||||||||||||||||||||||||||||||||||||||||||||||||||||||||||||||||||||||||||||||||||||||||||||||||||||||||||||||||||||||||||||||||||||||||||||||||||||||||||||||||||||||||||||||||||||||||||||||||||||||||||||||||||||||||||||||||||||||||||||||||||||||||||||||||||||||||||||||||||||||||||||||||||||||
| load.php[startup] | 62.3 KB | 54.2 KB | 8.1 KB | |||||||||||||||||||||||||||||||||||||||||||||||||||||||||||||||||||||||||||||||||||||||||||||||||||||||||||||||||||||||||||||||||||||||||||||||||||||||||||||||||||||||||||||||||||||||||||||||||||||||||||||||||||||||||||||||||||||||||||||||||||||||||||||||||||||||||||||||||||||||||||||||||||||||||||||||||||||||||||||||||||||||||||||||||
| https://auth.wikimedia.org/enwiki/wiki/Special:UserLogin...Special:UserLogin 3 scripts | 4.2 KB | 4.0 KB | 188 B | |||||||||||||||||||||||||||||||||||||||||||||||||||||||||||||||||||||||||||||||||||||||||||||||||||||||||||||||||||||||||||||||||||||||||||||||||||||||||||||||||||||||||||||||||||||||||||||||||||||||||||||||||||||||||||||||||||||||||||||||||||||||||||||||||||||||||||||||||||||||||||||||||||||||||||||||||||||||||||||||||||||||||||||||||
| URL | Total | Used | Unused | Unused % |
|---|---|---|---|---|
| load.php[styles:ext.uls.interlanguage] | 303.7 KB | 40.3 KB | 263.4 KB | |
| (inline stylesheet) 2 stylesheets | 207.0 KB | 2.6 KB | 204.4 KB | |
| https://auth.wikimedia.org/enwiki/wiki/Special:UserLogin...Special:UserLogin | 215 B | 215 B | 0 b |
A high unused-% on one run means this iteration loaded code that didn't get exercised, typical on first-load journeys before any user interaction. Drive the real flow by passing a navigation script as the input instead of a plain URL, with clicks and form fills placed between measure.start() and measure.stop(); anything in that window counts toward "used". The advice below is for code that's still unused after a representative run.
import(). Bundlers turn the import boundary into a separate chunk.defer or async so the parser doesn't block on code the page doesn't need yet.media= tricks or rel="preload" swaps.Tasks ≥ 50 ms blocking the main thread, collected via the Long Task API.
✓ No long tasks observed during this run.
A long animation frame (LOAF) is a frame that took ≥ 50 ms from input to the next paint. The part beyond the threshold is blocking time, the number that hurts Interaction to Next Paint and Total Blocking Time. Break long tasks up (scheduler.yield(), smaller chunks) or move the work off the main thread. Read more about the Long Animation Frames API.
1 more long frame carried no blocking time (nothing ran past the 50 ms threshold) — long, but harmless to INP and TBT.
All main-thread work during the full page load, not just the share that blocked input. Calculated from the Chrome trace.
parseHTMLstyleLayoutscriptParseCompilescriptEvaluationpaintCompositeRendergarbageCollectionotherMain-thread CPU time attributed to the individual modules inside concatenated JavaScript bundles (MediaWiki ResourceLoader), so a heavy bundle can be traced to the modules that actually cost the time.
The data comes from the extra profile run, not from the timed iterations.
| Module | Version | Self time |
|---|---|---|
jquery | xt2am | 24.5 ms |
ext.wikimediaEvents | qzzfn | 2.2 ms |
mediawiki.storage | 3elpb | 1.0 ms |
ext.testKitchen | 1phxy | 0.8 ms |
skins.vector.js | sv4bp | 0.4 ms |
ext.navigationTiming | 1u0am | 0.4 ms |
skins.vector.clientPreferences | 1aamm | 0.1 ms |
| – | 21.3 ms |
| Module | Version | Self time |
|---|---|---|
ext.visualEditor.supportCheck | 1ogmv | 0.1 ms |
| – | 1.4 ms |
The functions where main-thread JavaScript time was actually spent, sampled by Chrome's JavaScript profiler. Self time is spent in the function itself; total time includes the functions it called. For loader/dispatcher functions whose total dwarfs their self time, the runs line shows the top functions and modules (up to five, ≥ 1 ms) the total was actually spent running.
| Function | Where | Self time | Total time |
|---|---|---|---|
runScriptruns: load.php[scripts:ext.centralNotice.geoIP] (27.2 ms), load.php[scripts:ext.visualEditor.core.utils.parsing] (1.8 ms) | load.php[startup] | 9.0 ms | 49.6 ms |
setTimeout | 6.0 ms | 6.0 ms | |
appendChild | 5.7 ms | 5.7 ms | |
requireruns: load.php[scripts:ext.centralNotice.geoIP] (1.1 ms) | load.php[startup] | 4.9 ms | 11.8 ms |
impl | load.php[startup] | 4.6 ms | 6.0 ms |
(anonymous) | load.php[scripts:ext.centralNotice.geoIP] | 3.4 ms | 3.7 ms |
requestAnimationFrame | 2.6 ms | 2.6 ms | |
requestIdleCallback | 2.6 ms | 2.6 ms | |
(anonymous)runs: load.php[scripts:ext.centralNotice.geoIP] (13.4 ms) | load.php[scripts:ext.centralNotice.geoIP] | 2.3 ms | 15.8 ms |
(anonymous)runs: load.php[scripts:ext.centralNotice.geoIP] (8.4 ms) | load.php[scripts:ext.centralNotice.geoIP] | 2.1 ms | 13.4 ms |
eachruns: load.php[scripts:ext.centralNotice.geoIP] (3.8 ms) | load.php[scripts:ext.centralNotice.geoIP] | 1.8 ms | 8.6 ms |
(anonymous) | load.php[scripts:ext.centralNotice.geoIP] | 1.6 ms | 1.6 ms |
(anonymous) | load.php[scripts:ext.centralNotice.geoIP] | 1.6 ms | 1.6 ms |
doPropagationruns: load.php[startup] (42.6 ms) | load.php[startup] | 1.5 ms | 44.7 ms |
updateTooltipOnElement | load.php[scripts:ext.centralNotice.geoIP] | 1.5 ms | 2.4 ms |
How much setTimeout/setInterval work the page runs, credited to the script that scheduled each timer. Many zero-delay timers mean work sliced into a machine-gun of tiny tasks; repeating timers are polling.
| Set by | Delay | Type | Times set | Times fired | Fire time |
|---|---|---|---|---|---|
jquery | 0 ms | once | 34 | 34 | 25.8 ms |
jquery | 0 ms | once | 1 | 1 | 0.7 ms |
sendEvent in ext.testKitchen | 5000 ms | once | 1 | 1 | 0.7 ms |
SafeStorage in mediawiki.storage | 2000 ms | once | 2 | 2 | 0.5 ms |
ext.navigationTiming | 0 ms | once | 1 | 1 | 0.5 ms |
run in ext.wikimediaEvents | 60000 ms | once | 1 | 0 | 0.0 ms |
setActive in ext.wikimediaEvents | 100000 ms | once | 1 | 0 | 0.0 ms |
Main-thread CPU time from the Chrome trace split by domain. First party is wikipedia.org.
Animations that fell back from the compositor to the main thread, blocking each frame instead of running on the GPU.
Each chip below is a CSS property the page tried to animate that Chrome couldn't hand to the compositor. Swap it for a transform or opacity equivalent where you can.
border-bottom-color1×border-left-color1×box-shadow1×border-right-color1×border-top-color1×Want to dig deeper? Download the Chrome trace and drag-and-drop it into Performance in DevTools.